Citation Information
JoLS, J Life Sci, Vol. 2, No. 4, December 2020:38-58, https://doi.org/fmcz PMID: 33364626 PMCID: PMC7757640
T cells are an integral component of the adaptive immune response via the recognition of peptides by the cell surface-expressed T cell receptor (TCR). Rearrangement of the TCR genes results in a highly polymorphic repertoire on the T cells within a given individual. Although the diverse repertoire is beneficial for immune responses to foreign pathogens, recognition of self-peptides by T cells can contribute to the development of autoimmune disorders. Increasing evidence supports a pathogenic role for T cells in autoimmune pathology, and it is of interest to determine the TCR repertoires involved in autoimmune disease development. In this review, we summarize methodologies and advancements in the TCR sequencing field and discuss recent studies focused on TCR sequencing in a variety of autoimmune conditions. The rapidly evolving methodology of TCR sequencing has the potential to allow for a better understanding of autoimmune disease pathogenesis, identify disease-specific biomarkers, and aid in developing therapies to prevent and treat a number of these disorders.
Key Words: T cell receptor, TCR sequencing, autoimmunity, MHC, HLA
Introduction
Major histocompatibility complex (MHC)
A major genetic determinant conferring risk for developing many autoimmune diseases resides in the human leukocyte antigen (HLA) locus on chromosome 6(1,2). HLA genes encode major histocompatibility complex (MHC) proteins, which are expressed on antigen presenting cells (APCs) and function to present peptide antigens to T cells. Peptides are pieces of intact proteins that have been degraded by the APC and are subsequently loaded onto the MHC molecule for presentation. The peptide-MHC (pMHC) on the cell surface of the APC in conjunction with the T cell receptor (TCR) is collectively termed the trimolecular complex, and T cells are restricted by both the presented peptide and MHC molecule (Figure 1).
In general, there are two classes of MHC molecules that present peptides to T cells. MHC class I is expressed on all nucleated cells, while MHC class II is expressed on specific cell types (e.g., dendritic cells, macrophages, and B cells). In humans, the polymorphic HLA class I genes include HLA-A, HLA-B, and HLA-C, while the polymorphic class II genes are HLA-DR, HLA-DP, and HLA-DQ (Figure 2). Each individual inherits a combination of six class I and six class II alleles (two each of HLA-A, -B, -C, -DR, -DP, and -DQ). Each protein-expressed MHC variant possesses unique preferences for which peptides bind and are subsequently presented to activate T cells.
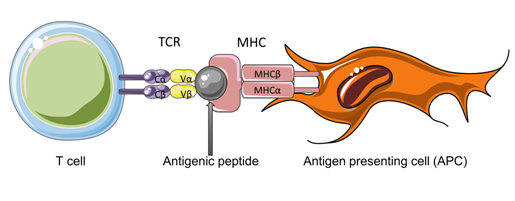
Figure 1. The trimolecular complex. Depicted is the trimolecular complex, comprised of a T cell bearing a T cell receptor (TCR), an antigenic peptide, and an antigen presenting cell (APC) expressing a major histocompatibility complex (MHC) molecule. The TCR consists of two chains, α and β, each bearing a constant (Cα, Cβ) region and a variable (Vα, Vβ) region. The variable regions are in direct contact with the antigenic peptide and surface of the MHC molecule.
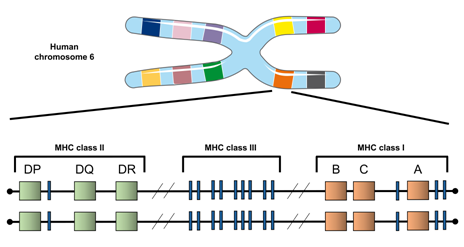
Figure 2. The HLA locus in humans. Shown is a rendering of chromosome 6 in humans, where HLA genes reside. The relative locations of the three class II (HLA-DP, HLA-DQ, HLA-DR) and the three class I (HLA-B, HLA-C, HLA-A) molecules are displayed. The function of the class III molecules are not well defined, but they are not thought to be involved in antigen processing and presentation.
T cells and T cell receptor (TCR) rearrangement
Two main subtypes of T cells are involved in cell-mediated immunity: CD8 and CD4 T cells. CD8 T cells are cytotoxic T cells that respond to peptide presented in the context of MHC class I and directly kill infected cells. In contrast, CD4 T cells are T helper cells (Th cells) which respond to peptides presented by MHC class II and aid in stimulating other immune cells such as macrophages, B cells, and cytotoxic CD8 T cells. CD4 T cells can stimulate these cells either via secretion of cytokines or by upregulating costimulatory molecules on their surface. One subset of CD4 T cells include regulatory T cells (Tregs), and these cells function to suppress immune responses and maintain tolerance to self-tissues for the prevention of autoimmunity(3,4).
The TCR is cell surface-expressed and recognizes peptide bound to MHC with contact made to both the amino acid side chains of the presented peptide and the MHC molecule. The antigen specificity of any given TCR is determined by the amino acid sequence of the receptor. However, a TCR is not encoded by a single germline-encoded gene. Rather, it is generated by the combination of noncontiguous gene segments via a process called V(D)J recombination, leading to a diverse repertoire of TCRs in a given individual capable of recognizing nearly any peptide presented in the context of MHC (Figure 3). Progenitor cells give rise to T cells in the thymus where the process of V(D)J recombination occurs. The α and β chains of the TCR are each comprised of variable (V) and constant (C) regions. The TCRα locus consists of Vα and Jα gene segments, while the TCRβ locus contains Vβ, Dβ, and Jβ gene segments. First, the TCRβ chain undergoes somatic recombination of the D-J segments followed by V-DJ recombination. For the alpha chain, a V-J recombination event occurs (with no D segments contributing to the alpha chain). The V(D)J V region exon is transcribed and spliced to join either Cβ or Cα, and the mRNA is translated to form the TCRβ or TCRα chain, respectively. Pairing of the two chains forms the heterodimeric αβTCR. During the recombination events, N and P nucleotide additions occur due to enzymatic addition of random nucleotides and repair of the double stranded breaks required for recombination, respectively. Additionally, nucleotides are also deleted during the process, leading to further diversity of the TCR repertoire. As the C region of each chain is identical for any given species, the V region is of most interest in determining the antigen specificity of a given TCR. In fact, direct contact with the peptide presented by MHC occurs within the hypervariable complementary-determining region 3 (CDR3) loops of the V regions, and the CDR3 loops are considered the primary determinant of antigen specificity(5-9). In contrast, the CDR1 and CDR2 loops more directly contact the MHC helices.
TCR Sequencing Methods
The TCR repertoire within a given individual is diverse due to the recombination events randomly joining various V, D, and J gene segments, the occurrence of non-template insertions and deletions, and being comprised of two chains (α and β). It would be conceivable, then, that each TCR was specific for one peptide. Indeed, the estimated potential diversity of the TCR repertoire in humans is greater than 10e20; however, because the number of T cells in a human (~10e11) is far lower, every TCR must have some ability to cross-react with several different peptides(10-14). Although the TCR repertoire in an individual is highly diverse, infections, cancers, and autoimmune conditions can cause expansion of T cells bearing identical TCRs in a process known as clonal expansion. Clonally expanded T cells can be identified by sequencing of the TCR repertoire within an individual.
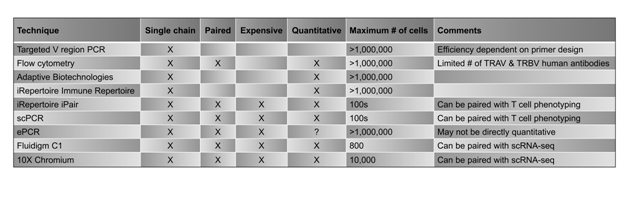
Several methodologies have been established over the last few years that have greatly enhanced the ability to identify TCRα, TCRβ, and paired αβTCR sequences from bulk samples and single-cell suspensions (Table 1). Traditionally, multiplex polymerase chain reaction (PCR) protocols have had the capacity to amplify and sequence only one TCR chain at a time, losing the pairing information for the complete αβTCR and, subsequently, the ability to determine the antigen specificity of a given TCR. However, there have been several recent studies in which both chains of the TCR were identified either in bulk samples or on single cells(15-22). Additionally, sophisticated statistical analyses have been developed to identify paired chains based on the probability of pairing due to frequencies of the chains in a given sample(23,24). As reviewed previously(25), there are several issues with each of these approaches, including the possibility that lower-frequency clones may be overlooked, α and β chains can be promiscuous(15,17,20),26, many TCRs utilize more than one α or β chain(15,27-29), as well as general PCR amplification and sequencing errors.
Another issue is associated with expanding primary T cells in cytokines for extended periods before sequencing, which can cause biases in the sequenced repertoire24,30,31. Therefore, in order to accurately assess the TCR repertoire of a given sample, an ideal methodology would assess T cells directly ex vivo with no manipulation via long-term culture supplemented with cytokines such as IL-2, IL-15, or TGF-β.
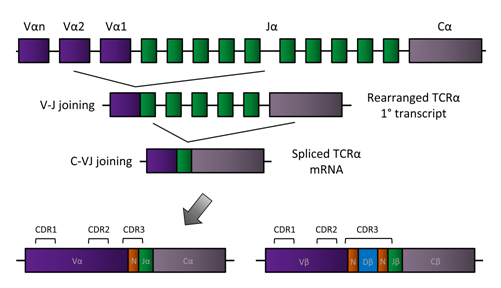 |
Figure 3. TCR rearrangement. A simplified model of TCR rearrangement is displayed for the TCRα chain in which Vα segments (purple, continuing to the left), Jα segments (green), and the Cα constant region join together to form functional α chains of TCRs. In the first step, one Vα segment and one Jα segment come together in a randomized process, and in the second step, the VαJα joins the constant region (Cα), which is identical for all TCRα chains. The bottom row shows the location of the three complementary-determining regions (CDRs) of the rearranged TCRα chain. Because random nucleotides are added and deleted at each step, the CDR3 region encompasses the area in which those additions and deletions occurred (N). The rearranged TCRβ chain is shown on the bottom right. Rearrangement of the TCRβ chain is identical to that of the TCRα chain except that there is an additional segment (Dβ), giving rise to two N regions in the final β chain.
Table 1. Selected TCR sequencing methods.
 |
Single chain TCR sequencing
Traditional TCR sequencing involved molecular cloning and Sanger sequencing(32,33). Typically, V region and C region primers were designed to amplify fragments of the TCR that included the CDR3 region. Although this methodology allowed for nucleotide-level determination of TCR CDR3 sequences, it was low-throughput and could sequence relatively few TCRs from a given sample.
Another pioneering method for TCR determination involved TCR V region analyses at the protein level using fluorescently-tagged monoclonal antibodies specific for particular TCR Vβ regions(34,35). Currently, monoclonal antibodies are available for the detection of both TCR Vα and Vβ families. Although V region information can be gleaned from bulk cell samples, the sequences of TCRs, especially those responsible for contacting pMHC (i.e., the CDR3 loops), cannot be determined using monoclonal antibodies.
High throughput TCR sequencing
A major breakthrough in TCR sequencing has been the usage of next generation sequencing (NGS) to deep sequence TCRs. Deep sequencing consists of sequencing a particular genomic region hundreds or thousands of times, and this methodology can identify clonal expansions within TCR repertoires. Commercially available options for determining αβTCR usage include the Immune Repertoire service by iRepertoire and the immunoSEQ platform by Adaptive Biotechnologies. Both utilize multiplex PCRs to separately amplify all Vα or Vβ regions of the TCRs in a given sample. As such, the most frequent TCRα or TCRβ sequences can be determined for any sample, allowing for identification of repeated sequences, indicative of clonal expansions of T cells. Although sequencing bulk cell populations in this manner can potentially sequence millions of cells (i.e., very deep sequencing), the Immune Repertoire and immunoSEQ technologies are both limited to either TCRα or TCRβ sequencing as opposed to identification of paired αβTCRs on single cells.
Single-cell TCR sequencing
Several methodologies have been developed to overcome the limitations of single chain TCR sequencing, including iPair from iRepertoire, single-cell PCR (scPCR)(16,18), and emulsion PCR (ePCR)19,20,36. Additionally, targeted or whole genome sequencing can be paired with TCR sequencing on single cells to analyze the phenotype, functional state, and activation status of T cells using reagents similar to scPCR with the inclusion of T cell phenotype-specific primers17. Paired TCR and genomic analyses can be performed using commercially-available instruments and kits from companies such as 10X Genomics (Chromium Single Cell Immune profiling paired with Single Cell Gene Expression), iRepertoire (iPair+), and Fluidigm (C1 single-cell mRNA sequencing with TraCeR analysis).
iPair, C1, and traditional scPCR involve sorting and separating single T cells. Sorting of the cells can be performed by magnetic bead sorting followed by dilution of the cells into one cell per well of a multi-well plate or by flow cytometry (fluorescence-activated cell sorting, FACS) into multi-well plates. Individual cells are barcoded for downstream identification before amplifying TCR sequences via subsequent PCR reactions. In this manner, each cell receives a unique barcode so that the TCR sequence can be traced back to one particular cell in the sample. Furthermore, some scPCR protocols include primers for determining T cell phenotypes(17). Although these technologies are able to pair the α and β TCR chains on single T cells, cell numbers are limited due to cost of reagents and technical feasibility. The C1 platform can accommodate up to 800 cells, and iPair and scPCR are typically performed on just a few hundred cells per sample, as they are sorted into 96 well plates. Therefore, these methodologies are most useful for samples in which the TCR repertoires contain clonal expansions and are considered to be skewed repertoires.
Another methodology that has been recently developed for the identification of αβTCR pairs is ePCR. ePCR has several advantages over other high-throughput sequencing approaches, including the ability to sequence large numbers of cells on a single-cell level, the capability of sequencing T cells directly ex vivo without cloning or expanding the cells using cytokines such as IL-2, and the capacity to amplify small amounts of template DNA. The cells are not sorted into multi-well plates; rather, cells are captured individually by vortexing the sample in an oil-in-water mixture, allowing for single cells to be captured and barcoded within each droplet. The PCR reactions are similar to those previously established for sequencing of TCR chains, but one key difference is that the reactions physically link the TCRα chain to the TCRβ chain for a given cell, generating a single αβTCR product that is sequenced together on a per-cell and per-patient sample basis. However, although optimization of the protocol has been performed(20,36-39), challenges with ePCR are abundant. For example, the size of the emulsion droplets can be an issue in terms of separating T cells into individual micro-reactors. Additionally, it has been argued that ePCR is not directly quantitative, and over-amplification of the top αβTCR pairs likely occurs for most emulsion samples(19).
In addition to TCR sequencing, important information about a single T cell can be determined by assessing the expression of hundreds of other genes related to properties such as metabolism, immune phenotype, or cell cycle. As such, methodologies have been developed to pair TCR sequencing with gene expression on single cells. 10x Genomics, iRepertoire, and Fluidigm have commercially available platforms for analyzing both TCR sequences and targeted or whole genome sequencing on a single-cell level. The Next GEM platform by 10X Genomics barcodes single cells and captures them in an oil mixture before subsequently generating cDNA. The cDNA can then be split into aliquots for single-cell TCR sequencing and single-cell RNA sequencing. As the cells are barcoded in the first step, the TCR information can be linked to RNA expression data via matching barcodes. According to protocols from 10X Genomics, the maximum number of cells that can be loaded is 10,000 per run. iRepertoire can combine its iPair technology with targeted gene sequencing on a single-cell level after the cells have been sorted into 96 well plates. Fluidigm uses C1 single-cell mRNA sequencing to first determine RNA sequencing data from single cells that can then be analyzed via TraCeR to reconstruct TCR sequences from those data. Per Fluidigm protocols, C1 technology can analyze up to 800 cells per run.
A number of these TCR sequencing technologies have been utilized to characterize T cells in autoimmune diseases.
TCR sequencing in autoimmune diseases
It is of interest to identify clonal expansions of T cells involved in autoimmune disease pathogenesis or those that are important for the prevention of autoimmunity. Many autoimmune diseases are linked to specific HLA genes. Therefore, knowing the TCR component of the trimolecular complex would enable a better understanding of the potential peptide(s) driving disease pathogenesis and allow for the identification of T cell biomarkers at the genomic level. Similarly, knowing the TCR repertoires that play a role in protection from autoimmunity or in immune homeostasis would aid in developing preventative therapeutics for those genetically at risk for developing such diseases.
One disadvantage of studying T cells involved in autoimmune pathogenesis is that they typically comprise a small percentage of all T cells in the peripheral blood or even within the primary organ involved in the autoimmune process. Therefore, pathogenic T cells from patients are often expanded using disease-specific antigens of interest. Another method to focus the sequencing on antigen-specific T cells involves isolating the pertinent cells using fluorescent MHC tetramers (or multimers) consisting of specific pMHC complexes. Using these reagents, the fluorescently labeled T cells can be detected and quantified by flow cytometry or cell sorted for downstream applications such as TCR sequencing.
TCR sequencing has been performed on human T cells in a variety of autoimmune diseases, including celiac disease (CD), type 1 diabetes (T1D), systemic lupus erythematosus (SLE), rheumatoid arthritis (RA), and Löfgren's syndrome (LS). Pertinent TCR sequencing findings for each disease are discussed below.
Celiac disease (CD)
One of the most common autoimmune conditions worldwide is celiac disease (CD), with a prevalence of ~1%(41,42). In CD patients, damage to the small intestine occurs after consumption of gluten, a collective term for proteins found in wheat, rye, barley, and other cereal grains(43). Gastrointestinal and extra-intestinal forms of the disease can both lead to nutrient malabsorption, and symptoms include diarrhea, weight loss, constipation, anemia, osteoporosis, neurologic disorders, and skin manifestations(41). CD has a strong MHC class II linkage, with HLA-DQ2 and HLA-DQ8 being the major genetic risk factors for disease development($4). The immune response leading to CD pathophysiology has been well studied and involves post-translational modification of gluten peptides via a process of deamidation (glutamate → glutamine) mediated by tissue transglutaminase(45). Recognition of these modified gluten peptides by HLA-DQ8- and HLA-DQ2-restricted CD4 T cells leads to an adaptive immune response involved in CD pathogenesis46,47.
Several studies have sequenced TCRs from CD4 T cells isolated from peripheral blood and the small intestines of CD patients. Peripheral blood T cells isolated from gluten-challenged CD patients using gliadin/DQ2 tetramers have demonstrated a TRBV7-2 preference4(48,49)>. In a another study, gliadin/DQ2 tetramer-specific peripheral blood CD4 T cells were isolated after gluten challenge, and TCRs were directly sequenced without expansion50/sup. Preferential TRBV usage with TRBV7 was confirmed, and TRBV20, TRAV26, and TRAV4 were also identified as commonly used TCR chains. Another group expanded CD4 T cells from small intestinal biopsies of CD patients and observed TRBV7-2/TRAV26-1 biases along with clones bearing TRBV20-1 or TRBV29-1(51). One study isolated DNA from the duodenal mucosa and found identical CDR3β motifs comprising a high percentage of the repertoires in CD patients, with TRBV6 and TRBV7 being overrepresented(52). Several groups have also focused on analyzing DQ8-restricted CD4 T cells from the small intestines of CD patients(53-55). The findings indicated that tetramer+ cells predominantly expressed TRBV9 with differing TCRα chains. Taken together, these studies identified preferred TCRβ chain usage for T cells restricted to gliadin/DQ2 and gliadin/DQ8 with varying TCRα chain usage for each.
A recent study looked at the TCRβ repertoires of peripheral blood and intestinal CD4 T cells before and after gluten challenge(56). When comparing the TCR diversity in the peripheral blood of all patients for the two time points, no difference in TRBV gene usage was seen pre- versus post-gluten challenge. However, when comparing within patients’ private repertoires (i.e., those TCR sequences unique to an individual and not shared between patients), increased usage of TRBV5, TRBV6, TRBV7, and TRBV18 was observed in some patients after gluten challenge. Within the sequencing results, previously identified public TCRβ clonotypes were found in both blood and gut repertoires. Another study examined the peripheral blood and intestinal TCR repertoires in CD patients over time(57). When assessing cells from CD patients for up to two years after beginning a gluten-free diet, the number of gluten-specific CD4 T cells decreased in all patients. The clonal diversity of CD4 T cells in both compartments increased, indicating that the large clonal expansions contracted after initiation of a gluten-free diet. CD patients were then given dietary gluten for 14 days, and the number of gluten-specific CD4 T cells increased and were comprised of expansions of clonal populations. The TCR repertoire of the expanded cells overlapped significantly with the repertoire prior to gluten challenge, indicating that these cells were likely expansions of pre-existing memory CD4 T cells that had been exposed to gluten in the past. The sequencing results included public CDR3 sequences that had been previously identified.
Type 1 diabetes (T1D)
One of the most common chronic diseases in children is type 1 diabetes (T1D), with incidence rates of approximately 1/300(58). Although often diagnosed in childhood, the disease can present at any age. The primary disease pathogenesis results from T cell-mediated destruction of the insulin-producing pancreatic beta cells, leading to a lifelong dependency on exogenous insulin. T1D patients develop autoantibodies that can be identified prior to clinical disease onset, and the presence of multiple autoantibodies is predictive of eventual T1D development(59). As there is no cure for the disease, understanding the T cell repertoire in the pancreatic islets and peripheral blood of T1D patients could enable the identification of biomarkers of active disease (e.g., immune infiltration into the pancreatic islets) and aid in developing immune therapies to prevent disease onset.
Sequencing of bulk alpha and beta chain TCR repertoires of antigen-expanded peripheral blood CD4 T cells from T1D patients has suggested shared TCRα chain usage, including TRAV38-1(60). Similar to celiac disease, fluorescent multimers have been used to identify dominant αβTCR clonotypes in peripheral blood samples from T1D patients. In one study, identical TCRα chains were shared amongst the three T1D patients, but they all paired with different TCRβ chains(61). When one T1D patient’s repertoire was assessed ten months later, the dominant clones were still present. Additionally, the dominant clones could not be detected directly ex vivo in control individuals, but they were detectable in 20% of autoantibody positive and 43% of recent onset T1D patients. Furthermore, clonal lines expressing the dominant clones were able to kill target cells in an antigen-specific manner.
Another study looked at TRBV repertoires of cells obtained from the pancreatic lymph nodes (pLN) and spleens of T1D and non-diabetic organ donors62. The study identified known T1D CD8 clones, one of which accounted for more than 25% of all TCR sequences in the pLN of one donor. There was more CDR3β overlap between pLN, spleen, and other lymph nodes in T1D than in those tissues from non-diabetic donors. These findings indicate the potential to track disease-specific clones using the CDR3 region of TCRβ chains across immune organs in T1D.
Paired αβTCR sequences from the residual pancreatic islets of three T1D organ donors were obtained in a different study using single-cell sequencing on flow-sorted CD4 and CD8 T cells(18). Although the majority of the TCR sequences were unique, several CD4 and CD8 TCR sequences were detected multiple times within each patient and from separate islet samples, suggesting clonal expansions within the pancreatic islets. Antigen specificity of the expanded clones was studied and found to be specific for (pro)insulin peptides.
A recent study isolated peripheral blood CD8 T cells from T1D patients and non-diabetic individuals and then sequenced αβTCRs of the cells that were reactive to a zinc transporter 8 (ZnT8) peptide, a self-antigen in T1D(63). The study did not isolate single cells, but rather, TCRα and TCRβ chains were sequenced from bulk sorted CD8 T cells after separating the cells based upon activation and phenotypic markers. As with previous studies, identical CDR3 sequences were repeated within individuals but were not shared amongst different individuals. In one patient, a sample taken nine months later was stimulated with ZnT8, and several of the same TCRs were found in ZnT8-responsive cells, indicating persistence of this self-antigen specific CD8 T cell clone.
Systemic lupus erythematosus (SLE)
Another relatively common autoimmune disorder is systemic lupus erythematosus (SLE), with worldwide incidence ranging from 0.3 – 500 per 100,000(64). SLE is a systemic autoimmune condition with varying symptoms and clinical presentations, and although multiple autoantibodies are associated with the disease, those targeting nucleic acids are the hallmark(65). Furthermore, the strongest genetic risk for development of SLE is within the MHC, implicating both class I and class II (in particular, HLA-DQ2 and HLA-DR3)(66-69). T cells are thought to play a role in SLE pathogenesis due to their association with the MHC molecules implicated in genetic risk, their interactions with autoantibody-producing B cells, and the ability of adoptively-transferred T cells to cause a disease similar to lupus in mouse models of SLE(65). Furthermore, studies have described T cell infiltration of the kidneys, one of the major organs affected by SLE(70-72). Therefore, identifying clonal expansions of T cells in SLE patients would be beneficial for a better understanding of disease pathogenesis, biomarkers, and potential treatment strategies.
In a study looking at the TCRβ repertoires of CD4 and CD8 T cells in the peripheral blood and renal biopsies from SLE patients, clonal expansions revealed eight predominant TRBV genes(73). The authors biopsied various regions of the kidney and compared clonotypes from each section within individuals. In one instance, a TRBV3-expressing CD8 clone was found in five regions of the kidney in one patient, and there were other SLE patients with TCRs shared on T cells from two or more regions of the kidney.
Another study looked at TCRβ usage on T cells from the peripheral blood of control and SLE patients(74). A higher percentage of T cell clones were found in the SLE group than in controls, but there was no overlap in clonal sequences between individuals (i.e., the repertoires were private). The TCRβ sequences from T cells within blood of control and SLE patients have also been examined(75). There was a slight decrease in TCR diversity within the SLE group compared to controls (indicating clonal expansions), and the frequencies of TRBV families were different in the two groups, with TRBV25-1 and TRBV7-6 being found in nearly half of the SLE patients but in none of the controls. A similar study found nearly 200 clones that were unique to SLE patients as opposed to controls or rheumatoid arthritis patients(76). The authors demonstrated that disease activity scores correlated with the number of SLE-associated clones.
A longitudinal study of clonotypes in SLE patients looked at the TCRβ repertoire during one period of an active disease flare and two quiescence periods(77). A two-fold reduction in TCRβ repertoire diversity was observed during the quiescent phases relative to controls, and clonal expansions trended toward being significantly higher in SLE patients when all time points were combined relative to controls. Four TRBV genes were differentially expressed on T cells from SLE: TRBV5-4, TRBV5-5, TRBV5-6, and TRBV21-1, but no CDR3β sharing was observed. The data did not suggest a change in disease activity correlated with an overt expansion of T cell clones or a contraction of the repertoire.
Rheumatoid arthritis (RA)
Another common autoimmune condition is rheumatoid arthritis (RA), a chronic inflammatory condition that mainly manifests in the joints. The worldwide prevalence of RA is between 0.5 – 1% of the population, and the major genetic determinant lies within the HLA locus, primarily due to associations with particular HLA-DR4 alleles(78). As with SLE, the presence of autoantibodies is indicative of disease activity, and damage to the joints occurs due to infiltration of cells into the synovial compartment(79). T cells make up a large percentage of the cells that infiltrate the joints, and they are thought to play a role in RA disease pathogenesis(80). In support of this theory, recent studies have observed decreased TCR repertoire diversity in peripheral blood and synovial fluid of RA patients(81,82). Therapies targeting T cell activation, as well as therapies deleting T cells, are efficacious in treating RA, and the discovery of autoreactive T cells specific for modified self-proteins also support T cell involvement in RA(79).
In one study, 53 clones were identified as being unique to RA compared to SLE patients and controls(76). Several TRBV gene segments were expanded in RA patients, and the repertoire was less diverse than that in the controls. Furthermore, the diversity was lower in RA patients with higher disease activity compared to those with lower disease activity scores.
In HLA-DR4 individuals in the early stages of RA, one study found an enrichment of T cells bearing TRBV25 in peripheral blood and synovial fluid samples after expansion with collagen peptides(83). An independent study confirmed the biased repertoire of RA patients that included TRBV25-expressing clones(84). Further analyses of collagen-stimulated blood cells from early HLA-DR4 RA patients showed that TRBV25-bearing T cells were more frequently expanded in those with moderate to high disease activity(85).
One study sought to compare TCRβ repertoires in an inflamed joint, various points throughout a single joint, multiple joints, synovial fluid, and peripheral blood(86). Identical TCRβ clones were detected in multiple locations within one joint and also from multiple joints. Overlap of the TCRβ repertoire was found between inflamed joints and synovial tissue, but the largest overlap was within and between joints.
A recent study aimed to identify TCRβ expansions in the peripheral blood of RA patients(87). TCRβ repertoires of the bulk samples had varying expansions and contractions of particular TRBV populations. In particular, CD4 T cells bearing TRBV3-1 were increased in RA blood versus controls. When comparing TCRβ repertoires of CD4 T cells in the synovial fluid of osteoarthritis patients as a control population, RA synovial fluid showed an increase in TRBV3-1 usage, consistent with the findings in peripheral blood.
Löfgren's Syndrome (LS)
Sarcoidosis is a systemic granulomatous disease that primarily affects the lungs and for which there has been no elucidated etiology. The most common manifestation of the disease is pulmonary sarcoidosis wherein granulomas from in the lungs, but the condition can also involve nearly any organ(88,89). An acute form of the disease, known as Löfgren's Syndrome (LS), has a more uniform clinical manifestation which includes fever, a specific skin rash (erythema nodosum), and bilateral hilar lymphadenopathy (enlarged lymph nodes in both lungs)(90,91). A strong genetic predisposition for LS lies within the MHC class II locus, with nearly all LS patients carrying both HLA-DR3 and HLA-DQ2(89,92). Several studies have shown that an infiltration of T cells occurs in the lungs of LS patients, indicating their likely involvement in LS disease pathogenesis(93). In fact, 90% of sarcoidosis patients have an increase in bronchoalveolar lavage (BAL) lymphocytes at the time of diagnosis(101). Furthermore, the accumulated CD4 T cells disappear with disease resolution, indicating that they play a role in disease pathogenesis(101). Knowing the TCR repertoire of the CD4 T cells that infiltrate the lungs of LS patients would aid in the understanding of disease pathogenesis and could help establish treatments.
Several studies have shown that a high percentage of the lung-infiltrating CD4 T cells in LS patients express TRAV12-1(103-109). One study sequenced BAL TRAV12-1 CD4 T cells and found shared TRAV12-1 CDR3α motifs three patients(105). Another study found that higher percentages of BAL TRAV12-1-expressing CD4 T cells correlated with shorter duration of disease(106). However, there was no association between TRAV12-1-expressing CD4 BAL T cell numbers and measures of lung function.
Studies have identified an expansion of CD4 T cells expressing TRBV2 alone(108,110) or paired with TRAV12-1(40) in LS patient BAL samples. Several CDR3α and CDR3β motifs were found in multiple LS patients but not in HLA-matched controls or patients with other lung diseases, including those with non-LS sarcoidosis(40). In contrast, an expansion of TRAV12-1/TRBV2 CD4 T cells was not observed in any peripheral blood samples, indicating that these cells had trafficked to the lungs, clonally expanded, and were very likely involved in disease pathogenesis.
Advances in the TCR field
It is difficult and oftentimes impossible to maintain antigen-specific T cells in culture indefinitely or long enough to clone them for determination of their antigen specificity. However, approaches have been established for studying the antigen specificity of T cells and their corresponding TCRs. One such tool is to transduce an immortalized TCR null cell line with a TCR receptor of interest (termed a TCR transductant). TCR transductant cells are stable, grow rapidly in basic cell culture media to large numbers, and do not depend on the functional state of the cell from which the TCR of interest originated. Although not useful for studying cytokine responsiveness, functional state, or T cell classification (Th1, Th2, Treg, etc.) of the original T cells, TCR transductants provide useful information regarding the antigen specificity of a given TCR.
As described above, MHC tetramers are another useful resource for identifying, isolating, and characterizing T cells and TCRs. As more antigens are identified and implicated in autoimmune disorders with known MHC associations, tetramers can be generated and will subsequently allow for the sequencing of disease-relevant (rather than bulk) TCRs.
In a similar sense, pMHC-TCR modeling and crystallization are becoming more sophisticated. Having more information regarding the molecular structures of autoimmune trimolecular complexes will aid in potential therapeutic strategies. For example, small molecule inhibitors of autoimmune-associated HLA molecules that block the presentation of self-peptides and inhibit subsequent T cell activation have been identified(111-115). For example, clinical trials have been completed and more are underway using a small molecule drug to block HLA-DQ8 in T1D(112).
Gaps in the TCR field
T cell clones are characterized by the expression of identical or highly related TCR Vα and/or Vβ genes and are public when present within multiple individuals. An individual T cell responds to a specific peptide, and T cell clones can dictate disease severity(116-123). In order for a public T cell response to occur, the T cells must be selected from approximately 10e20 different potential TCRs in humans after thymic selection(10-13). Furthermore, only ~10e11 T cells are estimated to be circulating in a human(10-14). Therefore, it is a rare occurrence for any given TCR to be repeated in an individual unless there is a selection bias occurring, usually due to antigen selection. This type of TCR bias has been demonstrated in CD4 T cells obtained from blood and tissues of human subjects in response to stimulatory antigens. The cells from blood or tissues are oftentimes clonally expanded ex vivo prior to TCR sequencing, but this step can lead to potential biases in the repertoires. Ideally, antigen-specific T cells would be sequenced for TCRs without manipulation of the starting population so as to garner a better understanding of the potential clonal expansion in vivo. Tetramers do address this issue to an extent, but only high affinity T cells are able to bind tetramers, so a large proportion of the lower affinity T cells that might play a role in autoimmune disease pathogenesis may be overlooked.
Another shortfall of TCR sequencing is the substantial cost of the more sophisticated techniques. Although prices for deep sequencing bulk T cell populations have decreased in the past several years, the field is turning more toward single-cell analyses. Single-cell TCR sequencing, including those from companies such as 10X Genomics, Fluidigm, and iRepertoire, are costly, and a limited number of single cells can be assessed per sample. Therefore, unless the population of cells being analyzed is extremely skewed, very few repeats of a given antigen-specific TCR may be captured by these methodologies. Therefore, it can be difficult to identify truly disease-relevant TCRs amongst the milieu, especially if the population contains small expansions of bystander (i.e., non-disease-associated) T cells.
Lastly, although TCRs have been identified as expanded in blood and tissues of patients with autoimmune conditions, a linkage between those TCRs and their functional relevance in disease pathophysiology has not been definitively confirmed. Although mouse models introducing cells bearing disease-associated TCRs exist (e.g., TCR transgenic and retrogenic mice), varying degrees of similarity between mouse models of autoimmune diseases and the human manifestations make interpretation difficult. Additionally, it is unknown whether differences between mouse and human immune systems outside of the T cell compartment might influence such studies.
Concluding remarks
The field of TCR sequencing has rapidly expanded, especially in the past 5-10 years with the advent of high throughput sequencing methods, single-cell sequencing, and sequencing in conjunction with gene expression. As cost, efficacy, and access to these technologies continue to improve, more autoimmune disease-associated TCRs will be identified in the tissues and peripheral blood. Disease-relevant TCRs that circulate in blood hold the promise to be effective biomarkers of disease activity for a number of disorders. With earlier detection of autoimmunity, especially prior to clinical symptoms, therapies can be appropriately timed to delay or prevent disease onset and reduce flares. Additionally, as targeted therapeutics directed at the pMHC-TCR complex complete clinical testing, it is conceivable that personalized medicine to treat autoimmune conditions may be close at hand.
Acknowledgements: This work was supported by NIH Grants (DK108868, DK110845, DK032083, DK032493, DK116073), the Juvenile Diabetes Research Foundation (3-PDF-2020-943-A-N), and the Children’s Diabetes Foundation.
References
|
1. Mungall AJ, Palmer SA, Sims SK, et al. The DNA sequence and analysis of human chromosome 6. Nature. 2003;425(6960):805-811. https://doi.org/10.1038/nature02055 PMid:14574404 | |
|
2. Consortium TM sequencing. Complete sequence and gene map of a human major histocompatibility complex. The MHC sequencing consortium. Nature. 1999;401(6756):921-923. https://doi.org/10.1038/44853 PMid:10553908 | |
|
3. Vandenbark AA, Offner H. Critical evaluation of regulatory T cells in autoimmunity: are the most potent regulatory specificities being ignored? Immunology. 2008;125(1):1-13. https://doi.org/10.1111/j.1365-2567.2008.02900.x PMid:18798915 PMCid:PMC2526254 | |
|
4. Sakaguchi S, Yamaguchi T, Nomura T, Ono M. Regulatory T cells and immune tolerance. Cell. 2008;133(5):775-787. https://doi.org/10.1016/j.cell.2008.05.009 |
|
|
5. Garboczi DN, Ghosh P, Utz U, Fan QR, Biddison WE, Wiley DC. Structure of the complex between human T-cell receptor, viral peptide and HLA-A2. Nature. 1996;384(6605):134-141. https://doi.org/10.1038/384134a0 PMid:8906788 |
|
|
6. Bentley GA, Mariuzza RA. The structure of the T cell antigen receptor. Annu Rev Immunol. 1996;14:563-590. ttps://doi.org/10.1146/annurev.immunol.14.1.563 PMid:8717525 |
|
|
7. Garcia KC, Adams EJ. How the T cell receptor sees antigen--a structural view. Cell. 2005;122(3):333-336. https://doi.org/10.1016/j.cell.2005.07.015 |
|
|
8. Davis MM, Bjorkman PJ. T-cell antigen receptor genes and T-cell recognition. Nature. 1988;334(6181):395-402. https://doi.org/10.1038/334395a0 |
|
|
9. Rudolph MG, Stanfield RL, Wilson IA. How TCRs bind MHCs, peptides, and coreceptors. Annu Rev Immunol. 2006;24:419-466. https://doi.org/10.1146/annurev.immunol.23.021704.115658 PMid:16551255 |
|
|
10. Zarnitsyna VI, Evavold BD, Schoettle LN, Blattman JN, Antia R. Estimating the diversity, completeness, and cross-reactivity of the T cell repertoire. Front Immunol. 2013;4:485. https://doi.org/10.3389/fimmu.2013.00485 PMid:24421780 PMCid:PMC3872652 |
|
|
11. Mason D. A very high level of crossreactivity is an essential feature of the T-cell receptor. Immunol Today. 1998;19(9):395-404. http://www.ncbi.nlm.nih.gov/pubmed/9745202 https://doi.org/10.1016/S0167-5699(98)01299-7 |
|
|
12. Mandl JN, Germain RN. Focusing in on T cell cross-reactivity. Cell. 2014;157(5):1006-1008. https://doi.org/10.1016/j.cell.2014.05.002 |
|
|
13. Shortman K, Egerton M, Spangrude GJ, Scollay R. The generation and fate of thymocytes. Semin Immunol. 1990;2(1):3-12. http://www.ncbi.nlm.nih.gov/pubmed/2129900 |
|
|
14. Arstila TP, Casrouge A, Baron V, Even J, Kanellopoulos J, Kourilsky P. A direct estimate of the human alphabeta T cell receptor diversity. Science. 1999;286(5441):958-961. http://www.ncbi.nlm.nih.gov/pubmed/10542151 https://doi.org/10.1126/science.286.5441.958 |
|
|
15. Cukalac T, Kan W-T, Dash P, et al. Paired TCRαβ analysis of virus-specific CD8(+) T cells exposes diversity in a previously defined "narrow" repertoire. Immunol Cell Biol. 2015;93(9):804-814. doi:10.1038/icb.2015.44 https://doi.org/10.1038/icb.2015.44 PMid:25804828 PMCid:PMC4618100 |
|
|
16. Kim S-M, Bhonsle L, Besgen P, et al. Analysis of the paired TCR α- and β-chains of single human T cells. PLoS One. 2012;7(5):e37338. doi:10.1371/journal.pone.0037338 https://doi.org/10.1371/journal.pone.0037338 PMid:22649519 PMCid:PMC3359365 |
|
|
17. Han A, Glanville J, Hansmann L, Davis MM. Linking T-cell receptor sequence to functional phenotype at the single-cell level. Nat Biotechnol. 2014;32(7):684-692. https://doi.org/10.1038/nbt.2938 PMid:24952902 PMCid:PMC4337815 |
|
|
18. Michels AW, Landry LG, McDaniel KA, et al. Islet-Derived CD4 T Cells Targeting Proinsulin in Human Autoimmune Diabetes. Diabetes. 2017;66(3):722-734. doi:10.2337/db16-1025 https://doi.org/10.2337/db16-1025 PMid:27920090 PMCid:PMC5319719 |
|
|
19. Munson DJ, Egelston CA, Chiotti KE, et al. Identification of shared TCR sequences from T cells in human breast cancer using emulsion RT-PCR. Proc Natl Acad Sci U S A. 2016;113(29):8272-8277. https://doi.org/10.1073/pnas.1606994113 PMid:27307436 PMCid:PMC4961128 |
|
|
20. Turchaninova MA, Britanova O V., Bolotin DA, et al. Pairing of T-cell receptor chains via emulsion PCR. Eur J Immunol. 2013;43(9):2507-2515. https://doi.org/10.1002/eji.201343453 PMid:23696157 |
|
|
21. Sun X, Saito M, Sato Y, et al. Unbiased analysis of TCRα/β chains at the single-cell level in human CD8+ T-cell subsets. PLoS One. 2012;7(7):e40386. doi:10.1371/journal.pone.0040386 https://doi.org/10.1371/journal.pone.0040386 PMid:22792299 PMCid:PMC3391256 |
|
|
22. Redmond D, Poran A, Elemento O. Single-cell TCRseq: paired recovery of entire T-cell alpha and beta chain transcripts in T-cell receptors from single-cell RNAseq. Genome Med. 2016;8(1):80. doi:10.1186/s13073-016-0335-7 https://doi.org/10.1186/s13073-016-0335-7 PMid:27460926 PMCid:PMC4962388 |
|
|
23. Howie B, Sherwood AM, Berkebile AD, et al. High-throughput pairing of T cell receptor α and β sequences. Sci Transl Med. 2015;7(301):301ra131. |
|
|
24. Jin P, Wang E, Provenzano M, et al. Molecular signatures induced by interleukin-2 on peripheral blood mononuclear cells and T cell subsets. J Transl Med. 2006;4(9):26. https://doi.org/10.1186/1479-5876-4-26 PMid:16805915 PMCid:PMC1557669 |
|
|
25. Lee ES, Thomas PG, Mold JE, Yates AJ. Identifying T Cell Receptors from High-Throughput Sequencing: Dealing with Promiscuity in TCRα and TCRβ Pairing. PLoS Comput Biol. 2017;13(1):e1005313. https://doi.org/10.1371/journal.pcbi.1005313 PMid:28103239 PMCid:PMC5289640 |
|
|
26. Dash P, McClaren JL, Oguin TH, et al. Paired analysis of TCRα and TCRβ chains at the single-cell level in mice. J Clin Invest. 2011;121(1):288-295. https://doi.org/10.1172/JCI44752 PMid:21135507 PMCid:PMC3007160 |
|
|
27. Padovan E, Casorati G, Dellabona P, Meyer S, Brockhaus M, Lanzavecchia A. Expression of two T cell receptor alpha chains: dual receptor T cells. Science. 1993;262(5132):422-424. http://www.ncbi.nlm.nih.gov/pubmed/8211163 https://doi.org/10.1126/science.8211163 PMid:8211163 |
|
|
28. Stubbington MJT, Lönnberg T, Proserpio V, et al. T cell fate and clonality inference from single-cell transcriptomes. Nat Methods. 2016;13(4):329-332. |
|
|
29. Eltahla AA, Rizzetto S, Pirozyan MR, et al. Linking the T cell receptor to the single cell transcriptome in antigen-specific human T cells. Immunol Cell Biol. 2016;94(6):604-611. https://doi.org/10.1038/icb.2016.16 PMid:26860370 |
|
|
30. Fontenot AP, Kotzin BL, Comment CE, Newman LS. Expansions of T-cell subsets expressing particular T-cell receptor variable regions in chronic beryllium disease. Am J Respir Cell Mol Biol. 1998;18(4):581-589. https://doi.org/10.1165/ajrcmb.18.4.2981 PMid:9533947 |
|
|
31. Dietrich PY, Walker PR, Schnuriger V, et al. TCR analysis reveals significant repertoire selection during in vitro lymphocyte culture. Int Immunol. 1997;9(8):1073-1083. http://www.ncbi.nlm.nih.gov/pubmed/9263004 https://doi.org/10.1093/intimm/9.8.1073 PMid:9263004 |
|
|
32. Sant'Angelo DB, Lucas B, Waterbury PG, et al. A molecular map of T cell development. Immunity. 1998;9(2):179-186. https://doi.org/10.1016/S1074-7613(00)80600-7 |
|
|
33. Correia-Neves M, Waltzinger C, Mathis D, Benoist C. The shaping of the T cell repertoire. Immunity. 2001;14(1):21-32. https://doi.org/10.1016/S1074-7613(01)00086-3 |
|
|
34. Faint JM, Pilling D, Akbar AN, Kitas GD, Bacon PA, Salmon M. Quantitative flow cytometry for the analysis of T cell receptor Vbeta chain expression. J Immunol Methods. 1999;225(1-2):53-60. https://doi.org/10.1016/S0022-1759(99)00027-7 |
|
|
35. Callan MF, Reyburn HT, Bowness P, et al. A method for producing monoclonal antibodies to human T-cell-receptor beta-chain variable regions. Proc Natl Acad Sci U S A. 1993;90(22):10454-10458. https://doi.org/10.1073/pnas.90.22.10454 PMid:8248131 PMCid:PMC47795 |
|
|
36. Williams R, Peisajovich SG, Miller OJ, Magdassi S, Tawfik DS, Griffiths AD. Amplification of complex gene libraries by emulsion PCR. Nat Methods. 2006;3(7):545-550. https://doi.org/10.1038/nmeth896 PMid:16791213 |
|
|
37. Schütze T, Glökler J. Idiot-proof emulsion PCR. Lab Times. Published online 2011:2011. |
|
|
38. Perrott J. Optimization and improvement of emulsion PCR for the ion torrent next-generation sequencing platform. Published online 2011. |
|
|
39. Shao K, Ding W, Wang F, Li H, Ma D, Wang H. Emulsion PCR: a high efficient way of PCR amplification of random DNA libraries in aptamer selection. PLoS One. 2011;6(9):e24910. https://doi.org/10.1371/journal.pone.0024910 PMid:21949784 PMCid:PMC3174225 |
|
|
40. Mitchell AM, Kaiser Y, Falta MT, et al. Shared αβ TCR Usage in Lungs of Sarcoidosis Patients with Löfgren's Syndrome. J Immunol. 2017;199(7):2279-2290. https://doi.org/10.4049/jimmunol.1700570 PMid:28827283 PMCid:PMC5675165 |
|
|
41. Caio G, Volta U, Sapone A, et al. Celiac disease: a comprehensive current review. BMC Med. 2019;17(1):142. doi:10.1186/s12916-019-1380-z |
|
|
42. Green PHR, Cellier C. Celiac disease. N Engl J Med. 2007;357(17):1731-1743. https://doi.org/10.1056/NEJMra071600 PMid:17960014 |
|
|
43. Fasano A, Catassi C. Clinical practice. Celiac disease. N Engl J Med. 2012;367(25):2419-2426. doi:10.1056/NEJMcp1113994 |
|
|
44. Sollid LM, Lie BA. Celiac disease genetics: current concepts and practical applications. Clin Gastroenterol Hepatol. 2005;3(9):843-851. https://doi.org/10.1016/S1542-3565(05)00532-X |
|
|
45. Dieterich W, Ehnis T, Bauer M, et al. Identification of tissue transglutaminase as the autoantigen of celiac disease. Nat Med. 1997;3(7):797-801. doi:10.1038/nm0797-797 https://doi.org/10.1038/nm0797-797 PMid:9212111 |
|
|
46. Molberg O, Mcadam SN, Körner R, et al. Tissue transglutaminase selectively modifies gliadin peptides that are recognized by gut-derived T cells in celiac disease. Nat Med. 1998;4(6):713-717. https://doi.org/10.1038/nm0698-713 PMid:9623982 |
|
|
47. Jabri B, Sollid LM. T Cells in Celiac Disease. J Immunol. 2017;198(8):3005-3014. https://doi.org/10.4049/jimmunol.1601693 PMid:28373482 PMCid:PMC5426360 |
|
|
48. Qiao S-W, Ráki M, Gunnarsen KS, et al. Posttranslational modification of gluten shapes TCR usage in celiac disease. J Immunol. 2011;187(6):3064-3071. https://doi.org/10.4049/jimmunol.1101526 PMid:21849672 |
|
|
49. Qiao S-W, Christophersen A, Lundin KEA, Sollid LM. Biased usage and preferred pairing of α- and β-chains of TCRs specific for an immunodominant gluten epitope in coeliac disease. Int Immunol. 2014;26(1):13-19. https://doi.org/10.1093/intimm/dxt037 PMid:24038601 |
|
|
50. Dahal-Koirala S, Risnes LF, Christophersen A, et al. TCR sequencing of single cells reactive to DQ2.5-glia-α2 and DQ2.5-glia-ω2 reveals clonal expansion and epitope-specific V-gene usage. Mucosal Immunol. 2016;9(3):587-596. https://doi.org/10.1038/mi.2015.147 PMid:26838051 |
|
|
51. Petersen J, Montserrat V, Mujico JR, et al. T-cell receptor recognition of HLA-DQ2-gliadin complexes associated with celiac disease. Nat Struct Mol Biol. 2014;21(5):480-488. https://doi.org/10.1038/nsmb.2817 PMid:24777060 |
|
|
52. Ritter J, Zimmermann K, Jöhrens K, et al. T-cell repertoires in refractory coeliac disease. Gut. 2018;67(4):644-653. doi:10.1136/gutjnl-2016-311816 |
|
|
53. Broughton SE, Petersen J, Theodossis A, et al. Biased T cell receptor usage directed against human leukocyte antigen DQ8-restricted gliadin peptides is associated with celiac disease. Immunity. 2012;37(4):611-621. https://doi.org/10.1016/j.immuni.2012.07.013 PMid:23063329 |
|
|
54. Petersen J, Kooy-Winkelaar Y, Loh KL, et al. Diverse T Cell Receptor Gene Usage in HLA-DQ8-Associated Celiac Disease Converges into a Consensus Binding Solution. Structure. 2016;24(10):1643-1657. https://doi.org/10.1016/j.str.2016.07.010 PMid:27568928 |
|
|
55. Petersen J, van Bergen J, Loh KL, et al. Determinants of gliadin-specific T cell selection in celiac disease. J Immunol. 2015;194(12):6112-6122. https://doi.org/10.4049/jimmunol.1500161 PMid:25948817 |
|
|
56. Yohannes DA, Freitag TL, de Kauwe A, et al. Deep sequencing of blood and gut T-cell receptor β-chains reveals gluten-induced immune signatures in celiac disease. Sci Rep. 2017;7(1):17977. https://doi.org/10.1038/s41598-017-18137-9 PMid:29269859 PMCid:PMC5740085 |
|
|
|
|
|
57. Risnes LF, Christophersen A, Dahal-Koirala S, et al. Disease-driving CD4+ T cell clonotypes persist for decades in celiac disease. J Clin Invest. 2018;128(6):2642-2650. https://doi.org/10.1172/JCI98819 PMid:29757191 PMCid:PMC5983310 |
|
|
58. Atkinson MA, Eisenbarth GS, Michels AW. Type 1 diabetes. Lancet (London, England). 2014;383(9911):69-82. doi:10.1016/S0140-6736(13)60591-7 |
|
|
59. Concannon P, Rich SS, Nepom GT. Genetics of type 1A diabetes. N Engl J Med. 2009;360(16):1646-1654. https://doi.org/10.1056/NEJMra0808284 |
|
|
60. Nakayama M, McDaniel K, Fitzgerald-Miller L, et al. Regulatory vs. inflammatory cytokine T-cell responses to mutated insulin peptides in healthy and type 1 diabetic subjects. Proc Natl Acad Sci. 2015;112(14):4429-4434. https://doi.org/10.1073/pnas.1502967112 PMid:25831495 PMCid:PMC4394309 |
|
|
61. Fuchs YF, Eugster A, Dietz S, et al. CD8+ T cells specific for the islet autoantigen IGRP are restricted in their T cell receptor chain usage. Sci Rep. 2017;7:44661. https://doi.org/10.1038/srep44661 PMid:28300170 PMCid:PMC5353542 |
|
|
62. Seay HR, Yusko E, Rothweiler SJ, et al. Tissue distribution and clonal diversity of the T and B cell repertoire in type 1 diabetes. JCI insight. 2016;1(20):e88242. https://doi.org/10.1172/jci.insight.88242 PMid:27942583 PMCid:PMC5135280 |
|
|
63. Ogura H, Preston-Hurlburt P, Perdigoto AL, et al. Identification and Analysis of Islet Antigen-Specific CD8+ T Cells with T Cell Libraries. J Immunol. 2018;201(6):1662-1670. https://doi.org/10.4049/jimmunol.1800267 PMid:30082321 PMCid:PMC6449153 |
|
|
64. Carter EE, Barr SG, Clarke AE. The global burden of SLE: prevalence, health disparities and socioeconomic impact. Nat Rev Rheumatol. 2016;12(10):605-620. https://doi.org/10.1038/nrrheum.2016.137 PMid:27558659 |
|
|
65. Tsokos GC, Lo MS, Costa Reis P, Sullivan KE. New insights into the immunopathogenesis of systemic lupus erythematosus. Nat Rev Rheumatol. 2016;12(12):716-730. https://doi.org/10.1038/nrrheum.2016.186 PMid:27872476 |
|
|
66. Relle M, Schwarting A. Role of MHC-linked susceptibility genes in the pathogenesis of human and murine lupus. Clin Dev Immunol. 2012;2012:584374. |
|
|
67. Smolen JS, Klippel JH, Penner E, et al. HLA-DR antigens in systemic lupus erythematosus: association with specificity of autoantibody responses to nuclear antigens. Ann Rheum Dis. 1987;46(6):457-462. https://doi.org/10.1136/ard.46.6.457 PMid:3498447 PMCid:PMC1002164 |
|
|
68. Eroglu GE, Kohler PF. Familial systemic lupus erythematosus: the role of genetic and environmental factors. Ann Rheum Dis. 2002;61(1):29-31. |
|
|
69. Tjernström F, Hellmer G, Nived O, Truedsson L, Sturfelt G. Synergetic effect between interleukin-1 receptor antagonist allele (IL1RN*2) and MHC class II (DR17,DQ2) in determining susceptibility to systemic lupus erythematosus. Lupus. 1999;8(2):103-108. https://doi.org/10.1191/096120399678847560 PMid:10192503 |
|
|
70. Alexopoulos E, Seron D, Hartley RB, Cameron JS. Lupus nephritis: correlation of interstitial cells with glomerular function. Kidney Int. 1990;37(1):100-109. https://doi.org/10.1038/ki.1990.14 PMid:1967662 |
|
|
71. Masutani K, Akahoshi M, Tsuruya K, et al. Predominance of Th1 immune response in diffuse proliferative lupus nephritis. Arthritis Rheum. 2001;44(9):2097-2106. https://doi.org/10.1002/1529-0131(200109)44:9<2097::AID-ART360>3.0.CO;2-6 |
|
|
72. Couzi L, Merville P, Deminière C, et al. Predominance of CD8+ T lymphocytes among periglomerular infiltrating cells and link to the prognosis of class III and class IV lupus nephritis. Arthritis Rheum. 2007;56(7):2362-2370. https://doi.org/10.1002/art.22654 PMid:17599764 |
|
|
73. Winchester R, Wiesendanger M, Zhang H-Z, et al. Immunologic characteristics of intrarenal T cells: trafficking of expanded CD8+ T cell β-chain clonotypes in progressive lupus nephritis. Arthritis Rheum. 2012;64(5):1589-1600. https://doi.org/10.1002/art.33488 PMid:22130908 PMCid:PMC3297718 |
|
|
74. Sui W, Hou X, Zou G, et al. Composition and variation analysis of the TCR β-chain CDR3 repertoire in systemic lupus erythematosus using high-throughput sequencing. Mol Immunol. 2015;67(2 Pt B):455-464. https://doi.org/10.1016/j.molimm.2015.07.012 PMid:26227771 |
|
|
75. Ye X, Wang Z, Ye Q, et al. High-Throughput Sequencing-Based Analysis of T Cell Repertoire in Lupus Nephritis. Front Immunol. 2020;11:1618. |
|
|
76. Liu X, Zhang W, Zhao M, et al. T cell receptor β repertoires as novel diagnostic markers for systemic lupus erythematosus and rheumatoid arthritis. Ann Rheum Dis. 2019;78(8):1070-1078. https://doi.org/10.1136/annrheumdis-2019-215442 PMid:31101603 |
|
|
77. Thapa DR, Tonikian R, Sun C, et al. Longitudinal analysis of peripheral blood T cell receptor diversity in patients with systemic lupus erythematosus by next-generation sequencing. Arthritis Res Ther. 2015;17:132. https://doi.org/10.1186/s13075-015-0655-9 PMid:26001779 PMCid:PMC4458014 |
|
|
78. Smolen JS, Aletaha D, McInnes IB. Rheumatoid arthritis. Lancet (London, England). 2016;388(10055):2023-2038. https://doi.org/10.1016/S0140-6736(16)30173-8 |
|
|
79. McInnes IB, Schett G. The pathogenesis of rheumatoid arthritis. N Engl J Med. 2011;365(23):2205-2219. https://doi.org/10.1056/NEJMra1004965 |
|
|
80. Mellado M, Martínez-Muñoz L, Cascio G, Lucas P, Pablos JL, Rodríguez-Frade JM. T Cell Migration in Rheumatoid Arthritis. Front Immunol. 2015;6:384. https://doi.org/10.3389/fimmu.2015.00384 PMid:26284069 PMCid:PMC4515597 |
|
|
81. Ishigaki K, Shoda H, Kochi Y, et al. Quantitative and qualitative characterization of expanded CD4+ T cell clones in rheumatoid arthritis patients. Sci Rep. 2015;5:12937. https://doi.org/10.1038/srep12937 PMid:26245356 PMCid:PMC4542667 |
|
|
82. Sakurai K, Ishigaki K, Shoda H, et al. HLA-DRB1 Shared Epitope Alleles and Disease Activity Are Correlated with Reduced T Cell Receptor Repertoire Diversity in CD4+ T Cells in Rheumatoid Arthritis. J Rheumatol. 2018;45(7):905-914. https://doi.org/10.3899/jrheum.170909 PMid:29657145 |
|
|
83. Ria F, Penitente R, De Santis M, et al. Collagen-specific T-cell repertoire in blood and synovial fluid varies with disease activity in early rheumatoid arthritis. Arthritis Res Ther. 2008;10(6):R135. https://doi.org/10.1186/ar2553 PMid:19014626 PMCid:PMC2656238 |
|
|
84. Zhou J, Kong C, Yu J, Dong H, Jin C, Song Q. Skewness of TCR Vβ of peripheral blood and synovial fluid of patients with rheumatoid arthritis. J Immunoassay Immunochem. 2014;35(2):207-219. https://doi.org/10.1080/15321819.2013.841192 PMid:24295183 |
|
|
85. Di Sante G, Tolusso B, Fedele AL, et al. Collagen Specific T-Cell Repertoire and HLA-DR Alleles: Biomarkers of Active Refractory Rheumatoid Arthritis. EBioMedicine. 2015;2(12):2037-2045. https://doi.org/10.1016/j.ebiom.2015.11.019 PMid:26844284 PMCid:PMC4703746 |
|
|
86. Musters A, Klarenbeek PL, Doorenspleet ME, et al. In Rheumatoid Arthritis, Synovitis at Different Inflammatory Sites Is Dominated by Shared but Patient-Specific T Cell Clones. J Immunol. 2018;201(2):417-422. https://doi.org/10.4049/jimmunol.1800421 PMid:29891556 |
|
|
87. Jiang X, Wang S, Zhou C, et al. Comprehensive TCR repertoire analysis of CD4+ T-cell subsets in rheumatoid arthritis. J Autoimmun. 2020;109:102432. https://doi.org/10.1016/j.jaut.2020.102432 PMid:32115259 |
|
|
88. Iannuzzi MC, Rybicki BA, Teirstein AS. Sarcoidosis. N Engl J Med. 2007;357(21):2153-2165. https://doi.org/10.1056/NEJMra071714 PMid:18032765 |
|
|
89. Newman LS, Rose CS, Maier LA. Sarcoidosis. N Engl J Med. 1997;336(17):1224-1234. https://doi.org/10.1056/NEJM199704243361706 PMid:9110911 |
|
|
90. Lofgren S, Lundback H. The bilateral hilar lymphoma syndrome; a study of the relation to age and sex in 212 cases. Acta Med Scand. 1952;142(4):259-264. http://www.ncbi.nlm.nih.gov/pubmed/14932793 https://doi.org/10.1111/j.0954-6820.1952.tb13864.x |
|
|
91. Häggmark A, Hamsten C, Wiklundh E, et al. Proteomic profiling reveals autoimmune targets in sarcoidosis. Am J Respir Crit Care Med. 2015;191(5):574-583. https://doi.org/10.1164/rccm.201407-1341OC PMid:25608002 |
|
|
92. Grunewald J. HLA associations and Löfgren's syndrome. Expert Rev Clin Immunol. 2012;8(1):55-62. https://doi.org/10.1586/eci.11.76 PMid:22149340 |
|
|
93. Grunewald J, Eklund A. Role of CD4+ T cells in sarcoidosis. Proc Am Thorac Soc. 2007;4(5):461-464. https://doi.org/10.1513/pats.200606-130MS |
|
|
94. Tanrıverdi H, Uygur F, Örnek T, et al. Comparison of the diagnostic value of different lymphocyte subpopulations in bronchoalveolar lavage fluid in patients with biopsy proven sarcoidosis. Sarcoidosis, Vasc Diffus lung Dis Off J WASOG. 2016;32(4):305-312. http://www.ncbi.nlm.nih.gov/pubmed/26847097 |
|
|
95. Bacha D, Ayadi-Kaddour A, Ismail O, El Mezni F. Bronchoalveolar lavage impact in sarcoidosis: study of 40 cases. Tunis Med. 2009;87(1):38-42. http://www.ncbi.nlm.nih.gov/pubmed/19522425 |
|
|
96. Winterbauer RH, Lammert J, Selland M, Wu R, Corley D, Springmeyer SC. Bronchoalveolar lavage cell populations in the diagnosis of sarcoidosis. Chest. 1993;104(2):352-361. http://www.ncbi.nlm.nih.gov/pubmed/8339618 https://doi.org/10.1378/chest.104.2.352 PMid:8339618 |
|
|
97. Wahlström J, Berlin M, Sköld CM, Wigzell H, Eklund A, Grunewald J. Phenotypic analysis of lymphocytes and monocytes/macrophages in peripheral blood and bronchoalveolar lavage fluid from patients with pulmonary sarcoidosis. Thorax. 1999;54(4):339-346. http://www.ncbi.nlm.nih.gov/pubmed/10092696 https://doi.org/10.1136/thx.54.4.339 PMid:10092696 PMCid:PMC1745457 |
|
|
98. Hyldgaard C, Kaae S, Riddervold M, Hoffmann HJ, Hilberg O. Value of s-ACE, BAL lymphocytosis, and CD4+/CD8+ and CD103+CD4+/CD4+ T-cell ratios in diagnosis of sarcoidosis. Eur Respir J. 2012;39(4):1037-1039. https://doi.org/10.1183/09031936.00144311 PMid:22467726 |
|
|
99. Danila E, Norkūniene J, Jurgauskiene L, Malickaite R. Diagnostic role of BAL fluid CD4/CD8 ratio in different radiographic and clinical forms of pulmonary sarcoidosis. Clin Respir J. 2009;3(4):214-221. https://doi.org/10.1111/j.1752-699X.2008.00126.x PMid:20298407 |
|
|
100. Oda K, Ishimoto H, Yatera K, et al. Relationship between the ratios of CD4/CD8 T-lymphocytes in the bronchoalveolar lavage fluid and lymph nodes in patients with sarcoidosis. Respir Investig. 2014;52(3):179-183. https://doi.org/10.1016/j.resinv.2013.12.003 PMid:24853018 |
|
|
101. Oswald-Richter KA, Richmond BW, Braun NA, et al. Reversal of global CD4+ subset dysfunction is associated with spontaneous clinical resolution of pulmonary sarcoidosis. J Immunol. 2013;190(11):5446-5453. https://doi.org/10.4049/jimmunol.1202891 PMid:23630356 PMCid:PMC3660530 |
|
|
102. Planck A, Eklund A, Grunewald J. Markers of activity in clinically recovered human leukocyte antigen-DR17-positive sarcoidosis patients. Eur Respir J. 2003;21(1):52-57. https://doi.org/10.1183/09031936.03.00059103 PMid:12570109 |
|
|
103. Grunewald J, Janson CH, Eklund A, et al. Restricted V alpha 2.3 gene usage by CD4+ T lymphocytes in bronchoalveolar lavage fluid from sarcoidosis patients correlates with HLA-DR3. Eur J Immunol. 1992;22(1):129-135. https://doi.org/10.1002/eji.1830220120 |
|
|
104. Grunewald J, Olerup O, Persson U, Ohrn MB, Wigzell H, Eklund A. T-cell receptor variable region gene usage by CD4+ and CD8+ T cells in bronchoalveolar lavage fluid and peripheral blood of sarcoidosis patients. Proc Natl Acad Sci U S A. 1994;91(11):4965-4969. http://www.ncbi.nlm.nih.gov/pubmed/7910965 https://doi.org/10.1073/pnas.91.11.4965 PMid:7910965 PMCid:PMC43910 |
|
|
105. Grunewald J, Hultman T, Bucht A, Eklund A, Wigzell H. Restricted usage of T cell receptor V alpha/J alpha gene segments with different nucleotide but identical amino acid sequences in HLA-DR3+ sarcoidosis patients. Mol Med. 1995;1(3):287-296. http://www.ncbi.nlm.nih.gov/pubmed/8529107 https://doi.org/10.1007/BF03401553 PMid:8529107 PMCid:PMC2229919 |
|
|
106. Grunewald J, Berlin M, Olerup O, Eklund A. Lung T-helper cells expressing T-cell receptor AV2S3 associate with clinical features of pulmonary sarcoidosis. Am J Respir Crit Care Med. 2000;161(3 Pt 1):814-818. https://doi.org/10.1164/ajrccm.161.3.9906001 |
|
|
107. Grunewald J, Wahlström J, Berlin M, Wigzell H, Eklund A, Olerup O. Lung restricted T cell receptor AV2S3+ CD4+ T cell expansions in sarcoidosis patients with a shared HLA-DRbeta chain conformation. Thorax. 2002;57(4):348-352. http://www.ncbi.nlm.nih.gov/pubmed/11923555 https://doi.org/10.1136/thorax.57.4.348 PMid:11923555 PMCid:PMC1746294 |
|
|
108. Grunewald J, Kaiser Y, Ostadkarampour M, et al. T-cell receptor-HLA-DRB1 associations suggest specific antigens in pulmonary sarcoidosis. Eur Respir J. 2016;47(3):898-909. https://doi.org/10.1183/13993003.01209-2015 PMid:26585430 |
|
|
109. Darlington P, Kullberg S, Eklund A, Grunewald J. Lung CD4+ Vα2.3+ T-cells in sarcoidosis cohorts with Löfgren's syndrome. Respir Res. 2020;21(1):61. https://doi.org/10.1186/s12931-020-1327-0 PMid:32111204 PMCid:PMC7048083 |
|
|
110. Ahlgren KM, Ruckdeschel T, Eklund A, Wahlström J, Grunewald J. T cell receptor-Vβ repertoires in lung and blood CD4+ and CD8+ T cells of pulmonary sarcoidosis patients. BMC Pulm Med. 2014;14:50. https://doi.org/10.1186/1471-2466-14-50 PMid:24656074 PMCid:PMC3997965 |
|
|
111. Ostrov DA, Gottlieb PA, Michels AW. Rationally designed small molecules to prevent type 1 diabetes. Curr Opin Endocrinol Diabetes Obes. 2019;26(2):90-95. https://doi.org/10.1097/MED.0000000000000470 PMid:30694829 PMCid:PMC6764771 |
|
|
112. Ostrov DA, Alkanani A, McDaniel KA, et al. Methyldopa blocks MHC class II binding to disease-specific antigens in autoimmune diabetes. J Clin Invest. 2018;128(5):1888-1902. https://doi.org/10.1172/JCI97739 PMid:29438107 PMCid:PMC5919818 |
|
|
113. Ji N, Somanaboeina A, Dixit A, et al. Small molecule inhibitor of antigen binding and presentation by HLA-DR2b as a therapeutic strategy for the treatment of multiple sclerosis. J Immunol. 2013;191(10):5074-5084. https://doi.org/10.4049/jimmunol.1300407 PMid:24123687 PMCid:PMC3891844 |
|
|
114. Li CW, Menconi F, Osman R, et al. Identifying a Small Molecule Blocking Antigen Presentation in Autoimmune Thyroiditis. J Biol Chem. 2016;291(8):4079-4090. https://doi.org/10.1074/jbc.M115.694687 PMid:26703475 PMCid:PMC4759184 |
|
|
115. Li CW, Osman R, Menconi F, Concepcion E, Tomer Y. Cepharanthine blocks TSH receptor peptide presentation by HLA-DR3: Therapeutic implications to Graves' disease. J Autoimmun. 2020;108:102402. https://doi.org/10.1016/j.jaut.2020.102402 PMid:31980336 |
|
|
116. Venturi V, Price D a, Douek DC, Davenport MP. The molecular basis for public T-cell responses? Nat Rev Immunol. 2008;8(3):231-238. https://doi.org/10.1038/nri2260 PMid:18301425 |
|
|
117. Turner SJ, Doherty PC, McCluskey J, Rossjohn J. Structural determinants of T-cell receptor bias in immunity. Nat Rev Immunol. 2006;6(12):883-894. PMid:17110956 https://doi.org/10.1038/nri1977 |
|
|
118. Li H, Ye C, Ji G, Han J. Determinants of public T cell responses. Cell Res. 2012;22(1):33-42. https://doi.org/10.1038/cr.2012.1 PMid:22212481 PMCid:PMC3351923 |
|
|
119. Wang GC, Dash P, McCullers JA, Doherty PC, Thomas PG. T cell receptor αβ diversity inversely correlates with pathogen-specific antibody levels in human cytomegalovirus infection. Sci Transl Med. 2012;4(128):128ra42. https://doi.org/10.1126/scitranslmed.3003647 PMid:22491952 PMCid:PMC3593633 |
|
|
120. Luo W, Su J, Zhang X-B, et al. Limited T cell receptor repertoire diversity in tuberculosis patients correlates with clinical severity. PLoS One. 2012;7(10):e48117. https://doi.org/10.1371/journal.pone.0048117 PMid:23110186 PMCid:PMC3482216 |
|
|
121. Frahm N, Kiepiela P, Adams S, et al. Control of human immunodeficiency virus replication by cytotoxic T lymphocytes targeting subdominant epitopes. Nat Immunol. 2006;7(2):173-178. https://doi.org/10.1038/ni1281 PMid:16369537 |
|
|
122. Ruckwardt TJ, Luongo C, Malloy AMW, et al. Responses against a subdominant CD8+ T cell epitope protect against immunopathology caused by a dominant epitope. J Immunol. 2010;185(8):4673-4680. https://doi.org/10.4049/jimmunol.1001606 PMid:20833834 PMCid:PMC4144756 |
|
|
123. Billam P, Bonaparte KL, Liu J, et al. T Cell receptor clonotype influences epitope hierarchy in the CD8+ T cell response to respiratory syncytial virus infection. J Biol Chem. 2011;286(6):4829-4841. https://doi.org/10.1074/jbc.M110.191437 PMid:21118816 PMCid:PMC3039322 |
|