Abstract:
The purpose of this study was to determine if therapeutic efficacy of a Cetuximab based near-infrared (NIR) targeted photo therapy (TPT) was dependent on light delivery strategies. We examined the cytotoxic effects of TPT in a pancreatic cancer mouse model, when administered to tumors interstitially and superficially.
A subcutaneous mouse model of pancreatic cancer using BXPC-3 - GFP cells was established in male athymic (nu/nu) mice. The mice received intravenous (IV) injection of Cetuximab-IR700DX, 24 hours prior to near-infrared light irradiation. Interstitial illumination was administered at a 400mW/cm fixed power output, at a light dose of 100 J/cm to half the mice and at 300 J/cm to the remaining mice. Superficial illumination was administered at a 150mw/cm2 fixed power density at a dose of 50 J/cm12 to half the mice, and at 250 J/cm2 to the other half. Cellular damage and decrease in cell viability were determined by the decrease in GFP fluorescence intensity levels in whole animal images and in relative intensity measurements.
Interstitially administered TPT resulted in greater long-term permanent damage (72 hours post treatment) to tumor cells (0% recovery at low dose, and 11% recovery at high dose) compared to superficially administered TPT (1% recovery at low dose, and 44% recovery at high dose). While these results demonstrated that near-infrared targeted photo therapy efficacy was dependent on the type of light delivery strategy, overall, both superficial and interstitial C[t-IR700DX based near-infrared targeted photo therapy can affect significant long-term damage (less signal recovery) to pancreatic cancer cells in vivo at lower doses regimens, compared to higher dose regimens (higher signal recovery).
Keywords:
Photo Therapy; Pancreatic Cancer; Cetuximab: PDAC; Photoimmunotherapy; 700DX; Near-Infrared; Photosensitizer;
Introduction
Pancreatic ductal adenocarcinoma (PDAC) is a highly lethal disease due to very late prognosis and its aggressive and metastatic nature (1- 3) (4), more effective therapeutic strategies are necessary to reduce the mortality rate attributed to this disease (5-10).
Targeted photo therapy (TPT), first introduced in 1983 (11), utilizes a photosensitized dye (photosensitizer, PS) conjugated to a tumor biomarker, that when activated by a light source (e.g. laser) of a specific energy and wavelength, causes selective ablation of local tumors, leaving surrounding normal tissue intact (12-14). In addition to enhanced tumor specificity, TPT offers additional advantages: the fluorescence properties of the PS may be used for the detection of cancers and to guide therapy (theranostics); depending on the PS, photo therapy can induce cell death by thermal damage or oxidative damage, bypass drug resistance mechanisms, and larger tumors and deeper lesions can be targeted with longer wavelength PS for deeper tissue penetration (15-16).
The efficacy of TPT to induce acute and long-term cytotoxic effects in vivo in different cancers via superficial illumination has been demonstrated (17-23). The aim of this study was to determine whether the method of light delivery affected the therapeutic response of cancer cells treated with TPT. In this study, we investigate the differences in therapeutic efficacy between interstitial and superficial illumination of TPT using an antibody-dye conjugate from Aspyrian Therapeutics, Inc. derived from Cetuximab and near-infrared dye IR700DX (Cet-IR700DX), in a mouse model of human pancreatic cancer.
Cetuximab is a chimeric mouse/human monoclonal antibody which binds specifically to Epidermal Growth Factor Receptor (EGFR). Cetuximab’s competitive inhibition of EGF and other ligands binding to EGFR, blocks EGFR signal transduction that promotes cell growth, thereby inducing cell apoptosis (44).
When conjugated to drugs, imaging agents, and other toxins (referred herein as loads), Cetuximab can be used to direct the attached loads to EGFR-expressing cells. Cetuximab and other EGFR antibodies are also used therapeutically for the treatment of KRAS wild-type EGFR-expressing metastatic colorectal, metastatic non-small cell lung, and head and neck cancers (44).
IR700DX, a water soluble phthalocyanine infrared fluorophore, was first developed as an imaging agent suitable for fluorescence imaging. However, it was determined that IR 700DX also possessed photosensitive properties, and could elicit cell phototoxicity when activated by light. One key advantage of IR700DX in comparison to earlier photosensitizers, is its capacity to elicit phototoxicity only when bound to target cells while unbound dye does not produce a therapeutic effect (45).
The rationale for conjugating the fluorescent dye and photosensitizer IR700DX with Cetuximab was two-fold: to visualize the tumor region using the IR700DX 's fluorescence properties, and to direct it to EGFR-overexpressing tumors for targeted phototherapy.
The green fluorescent protein (GFP) was utilized as an imaging tool (24-30) to assess qualitatively, quantitatively, and immunohistochemically, the therapeutic efficacy of TPT in vivo.
The outcome of this study demonstrated that the light delivery strategy also affects the efficiency of light-based therapy. Therefore, light illumination should be optimized along with pertinent TPT components such as drug dosage and drug delivery methods, to determine the maximum efficacy of the TPT modality.
Materials and methods
Synthesis of TPT conjugate (cetuximab-IR700DX)
The infrared dye, IRDye®700DX NHS ester was purchased from LI-COR Biosciences (Lincoln NE, USA). Cetuximab, a chimeric mouse/human mAb directed against EGFR was purchased from Myoderm (Norristown, PA, USA) as the Erbitux® (ImClone, LLC/Lilly/BMS) commercial product (Bristol-Meyers Squibb Co, Princeton, NJ, USA).
Erbitux (Cetuximab, 1 mg, 6.8 nmol) was incubated with the water-soluble silicon-phthalocyanine derivative IR Dye 700DX NHS ester (Li-COR, Lincoln, NE), or IR700 (66.8 μg, 34.2 nmol, 5 mmol/L in DMSO), in 0.1 mol/L Na2HPO4 (pH 8.5) at room temperature for 1 hour. After the incubation period, the mixture was buffer-exchanged and purified with phosphate-buffered saline (PBS, pH = 7.1) using Amicon Ultra-15 Centrifugal Filter Units (EMD Millipore Corporation, Billerica, MA). The final product purity, average drug to antibody ratio (DAR) and exact protein concentration were determined by size exclusion high pressure liquid chromatography (SE-HPLC) using the Agilent 1100 HPLC system equipped with a DAD detector monitoring at 280 and 690nm, fitted with a Shodex Protein KW-803, 8 x 300 mm (Phenomenex, cat. # KW-803) column. The SE-HPLC elution buffer was PBS (pH = 7.1) with a flow rate of 1 mL/min. The conjugation reaction resulted in a DAR of 2.8, final protein concentration of 5.5 mg/ml and product purity of 99.5%.
TPT laser system
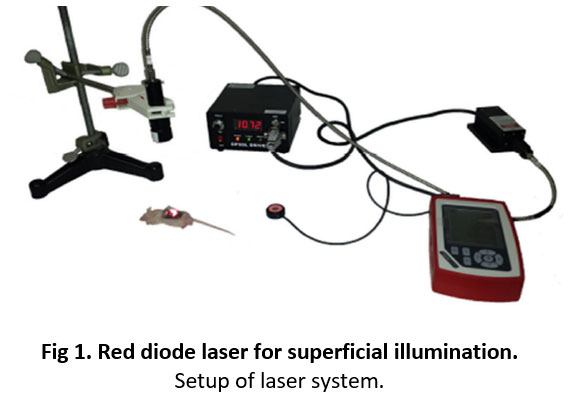
A red diode laser (model no. MRL-III-690-800, Changchun New Industries Optoelectronics Technology Co., Ltd., China) of fixed wavelength at 690±5 nm and a maximum power output of 800mW, was used to administer superficial light irradiation (Fig 1).
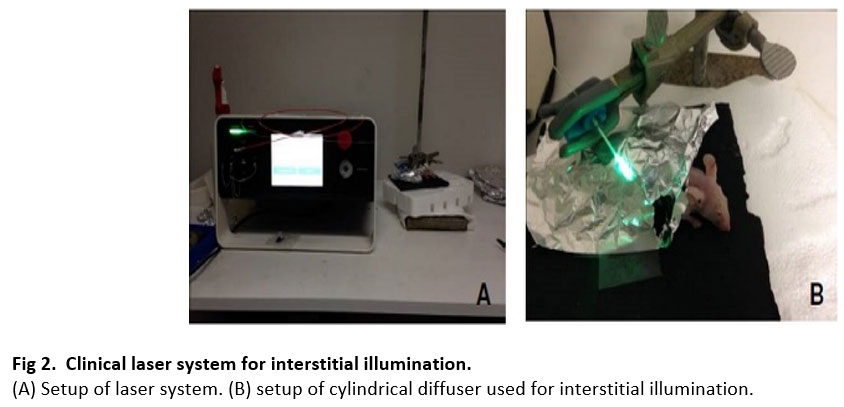
Interstitial light irradiation was administered through a 1 cm in length and 1.1 mm tip-width cylindrical diffuser (maximum output power of 1600 mW), attached at the end of an optical fiber, connected to the laser source of a clinical laser (model no. ML7710-69--ASP, Modulight, Inc., Finland) of fixed wavelength at 690±5 nm (Fig 2).
Stable green fluorescent protein (GFP) expressing BxPC-3 cells (BxPC3-GFP) from Anticancer, Inc., were developed using previously established transfection method [31]. BxPC3 cells were used for the in vivo study because they are compatible with Cetuximab (an Epidermal Growth Factor Receptor (EGFR) inhibitor) based treatment. BxPC3 cells express EGFR and have wild type KRAS (Kirsten ras oncogene homolog). Cells were grown in T-75 tissue culture flasks with RPMI 1640 culture media (Gibco-BRL, Grand Island, NY, USA) supplemented with 10% fetal bovine serum and 1% penicillin/streptomycin (Hyclone, Logan, UT, USA), and maintained in a humidified incubator at 37 â°C, 95% air and 5% carbon dioxide.
Animal model: bilateral BxPC-3 – GFP mouse flank model
The subcutaneous xenograft model was established by injecting 10 million BXPC-3 – GFP cells subcutaneously in the left and right flanks of male athymic (nu/nu) BALB/c mice (Anticancer, Inc., San Diego, CA) [32]. Animals were selected for treatment when the longest dimension of the subcutaneous tumors was between 7 to 10 mm in length. The size of the tumors was measured on the day of treatment using a caliper.
In vivo TPT experiment design
To evaluate the efficacy of Cet-IR700DX based NIR TPT via interstitial and superficial irradiation, mice with bilateral subcutaneous tumors were first separated into low and high TPT dosimetry groups herein referred to as treatment groups, with sample size starting at n = 5 per group. Each mouse was injected with 100 µg of Cet-IR700DX in PBS intravenously (IV) 24 hours prior to light irradiation. The day of IV injection was considered t=0h. At 24 hours after IV injection (t= 24h), the right flank tumor of each mouse was exposed prior to treatment through an incision on the skin. For interstitial irradiation, the right flank tumors of mice in the low and high dosimetry groups were then irradiated interstitially at 100 J/cm and 300 J/cm doses respectively with a 690nm wavelength light source at 400 mW/cm fixed laser power output. For superficial irradiation, the right flank tumors of mice in the low and high dosimetry groups were then irradiated superficially at 50 J/cm2 and 250 J/cm2 fluences respectively with a 690nm wavelength light source at 150 mW/cm2 fixed laser power output. The aforementioned dose levels were selected based on preliminary experiments.
Two different lasers were used for the purpose of the study due to the lasers design restrictions limiting the ability to administer both interstitial and superficial irradiation with one laser. The laser used for interstitial irradiation reported the light dose as optical energy delivered per beam diameter (J/cm). Whereas the laser used for superficial irradiation, reported the light dose as optical energy delivered per beam area (J/cm2).
Immediately after irradiation, the skin incision was sutured to cover the tumor prior to fluorescence imaging.
The fluorescence imaging and fluorescence intensity data of GFP were captured: 1) before IV to establish the baseline (at t=0h); 2) after IV and prior to TPT (at t=24 h) to detect and confirm drug localization in tumors; 3) immediately after TPT, and 4) at termination (t=96 h), 3 days after TPT; for a total of four imaging time points. After imaging, the mice were sacrificed at termination (t = 96 h), their tumors were excised, and harvested for further analysis and histological processing.
Animal care
All animal studies were conducted in compliance with guidelines outlined in the NIH Guide for the Care and Use of Animals under assurance number A3873-01. The method of euthanasia was consistent with the recommendations of the American Veterinary Medical Association (AVMA) Guidelines for the Euthanasia of Animals. The University of California San Diego animal care program has dedicated vivarium staff and veterinarians that frequently monitor the health and behavior of the animals housed in the vivarium. All research staff completed the required animal care, handling, and surgery training prior to conducting the experiments.
A total of 30 male, 6-week-old, athymic (nu/nu) BALB/c mice (Anticancer, Inc., San Diego, CA) were used in this project. They were maintained in a barrier facility on high efficiency particulate air-filtered racks. In general, mice were anesthetized during all experimental procedures causing more than slight pain or distress. A toe pinch was used to ensure adequate anesthesia prior to execution of surgical, irradiation, and imaging procedures. Anesthesia depth was monitored by measuring respiratory rate, heart rate, tail pinch, corneal and pedal reflexes, blood pressure, and body temperature. Anesthesia was achieved by (1) Isoflurane inhalation for procedures of very short duration, i.e. 5-20 minutes, or by (2) an intramuscular injection into the muscle of the hind limb of a mixture of 50% ketamine, 38% xylazine and 12% acepromazine maleate for the longer term surgical and imaging procedures (25-40 minutes). Whenever the pain was prolonged and could not be avoided, the animal was euthanized as soon as possible.
To facilitate the execution of procedures and to minimize injury, anesthetized mice were constrained with soft limb restraints during subcutaneous injection, irradiation, and imaging procedures. During the tail vein injection procedure of Cet-IR700DX conjugate, non-anesthetized mice were restrained with AIMS™ Humane Mouse Restrainer. The animals were carefully observed post procedures until they are fully awake and active. All animals were observed frequently during experiments, and daily during the 72-hours post irradiation observational period for signs of pain or infection. Signs of distress were reported to the vivarium animal heath staff and staff veterinarian for recommended treatment or euthanasia. No mortality occurred outside of planned euthanasia or humane endpoints.
At the completion of the observational period (at termination, t=96h), all 30 mice were euthanized while still under anesthesia (after last imaging and tumors excision) in a dedicated vivarium CO2 euthanasia chamber, supplied by compressed gas cylinders. Gas flow was maintained for 2 minutes after apparent clinical death; and death was verified before removing animals from the chamber.
In vivo fluorescence imaging
The whole animal fluorescence imaging and fluorescence intensity data of GFP were captured using the MAESTRO CRI in vivo imaging system (Cri, Woburn, MA, USA) and software (version 2.10.0).
The GFP fluorescence signal was detected using the Maestro pre-set blue filter set with a 455-nm excitation filter (435 to 480 nm range), and a 490 nm long-pass emission filter in 10 nm step imaging increments from 500 to 800 nm, at 350 ms fixed exposure time, and a pixel binning of 1x1. The resulting image containing the collective spectral fluorescence data from each wavelength within the 500 to 800 nm range was then unmixed using the Maestro software, to isolate the GFP emission wavelength containing the fluorescence intensity data of interest.
The 700DX dye fluorescence signal was detected using the Maestro pre-set red filter set with a 635-nm excitation filter (616 to 661 nm range), and a 675 nm long-pass emission filter in 10 nm step imaging increments from 670 to 900 nm, at 700 ms fixed exposure time, and a pixel binning of 1x1. Using the same method for above for GFP, the fluorescence intensity data for IR700DX was collected from the channel corresponding to the IR700DX emission wavelength of 700 nm.
In vivo fluorescence data acquisition
GFP intensity data were extracted from the resulting images using the regions of interest (ROI) method. The Maestro software used pixel counts to depict fluorescence intensity.
The in vivo fluorescence data acquired expressed in pixel counts included the total fluorescence intensity, ROI area, mean intensity, and standard of deviation of the mean. To compare the fluorescence intensity values across the different time points, the relative fluorescence intensity of GFP at each time point was calculated by taking the total fluorescence intensity of GFP at t=0h (baseline) and dividing the total fluorescence intensity of GFP at each time point by the baseline intensity.
Statistical analysis
The quantitative data were analyzed using the latest version of OpenStat statistical software by Bill Miller (33). As described in the experimental design section, 30 animals were selected randomly and equally distributed in 5 cages. Each cage was assigned a group based on TPT treatment (superficial and interstitial), and further categorized into a low light dose or high light dose group. One cage was designated a control group, which received no treatment. Each cage was the experimental unit of sample size n=6, and each animal was a biological replicate or observational unit (34). These numbers are estimates based on statistical analyses of preliminary data and previously published work using mice models in photo therapy studies (46).
For alpha of 0.05 and power of 0.8, the minimum required sample size per group (control and experimental) is 5. Twenty percent of additional animals was included in the total number to account for potential loss of animals during the experimental period.
Each animal in the experimental groups yielded two sets of results, for the control (untreated left flank tumor), and the treatment (treated right flank tumor), at four time points (before IV, before TPT, after TPT and 72 hours after TPT).
After testing the normality of the data using the Shapiro-Wills and Lilliefors tests, the One-Factor Analysis of Variance (ANOVA) with Repeated Measures test followed by the post-hoc Tukey Kramer’s test, was used to analyze the difference in mean GFP fluorescence intensities among the four time points (repeated measure) in each dose group (factor). The Kruskal-Wallis H One Way ANOVA test followed by the post-hoc Mann-Whitey U test was used to analyze the difference in mean GFP fluorescence intensities between each dose group (control, low dose, and high dose) at individual time points (34,35). Statistical results with p<0.05 were considered statistically significant.
The GFP fluorescence intensity measurements of the left control and right treated tumors of each treatment group were averaged, and the mean intensities were plotted as relative intensity ± standard deviation of the mean intensity.
Histological and immunohistochemical analysis
After the mice were sacrificed at t=96h, the subcutaneous tumors were excised and fixed in formalin for 24 hours. After formalin fixation, the tumors were dehydrated, paraffin-embedded, and cut in 5 µm sections that were then placed on glass slides for GFP immunohistochemical staining and standard Hematoxylin and Eosin (H&E) histological staining.
H&E histological staining was performed to demonstrate necrosis and morphology of damaged tissue compared to undamaged tissue. The Hematoxylin dye stained the nucleus of the cells blue, and the Eosin dye stained other cellular and tissue structures pink, orange, and red.
GFP immunohistochemical staining was performed to demonstrate treatment efficacy and tumor viability. To assess the presence of GFP in cells, tissue sections were stained using a polymer based peroxidase system (ImmPRESS HRP Anti-Goat Ig (Peroxidase) Polymer Detection Kit, Vectorlabs Inc., Burlingame, CA). Tissue sections were incubated with a Goat - anti GFP polyclonal primary antibody (Novus Biologicals, LLC, Littleton CO) at 1:1000 dilution overnight in 4 â°C, followed by incubation in ImmPRESS Anti-Goat Peroxidase Polymer reagent for 30 minutes to select for GFP containing cells. Selection was detected with brown peroxidase substrate DAB (3, 3’-diaminobenzidine). The tissue sections were counterstained with Hematoxylin (blue color) for nuclear selection and Fast Green FCF (green color) for selection of the remaining tissue structures.
Images of the stained sections were acquired using a microscope (Nikon E600 upright fluorescence microscope) equipped with a digital camera (Spot QE color camera) from the UCSD Cancer Center Microscopy Shared Facility Core.
Results
Prior to TPT treatment, baseline was established by selecting untreated (conjugate and irradiation naïve) healthy animals weighing on average 20 grams, and whose subcutaneous tumors have reached 7-10 mm in length. The six animals originally allocated per group prior to treatment were included in the qualitative and quantitative data analysis reported herein.
Qualitative analysis of real-time in vivo GFP fluorescence intensity
After superficial TPT treatment at 50 J/cm2 and 250 J/cm2 light doses on the right flank tumors, loss of GFP fluorescence was visible compared to the control left flank tumors. Seventy-two hours after treatment, very little GFP signal was observed on the right flank tumor of the animal treated with 50 J/cm2. However, visible GFP fluorescence signal returned on the right flank tumor of the animal treated at 250 J/cm2 (Fig 3).
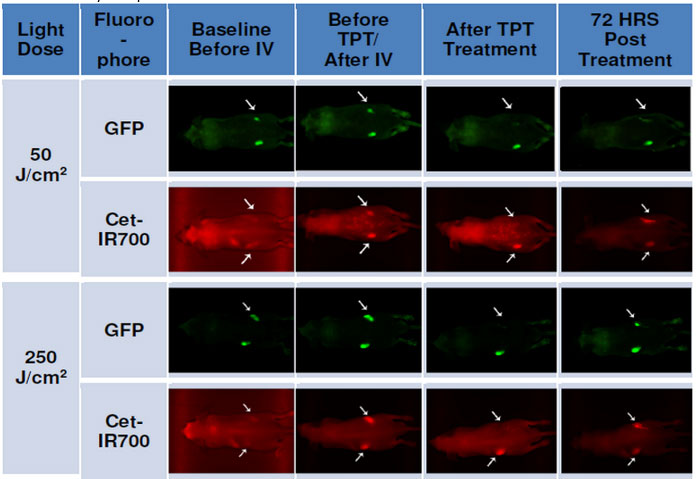
Fig 3. Whole animal imaging of GFP (green) and Cet-IR700 (red) fluorescence of mice treated with superficial irradiation.
1) before intravenous (IV) injection of Cet-IR700DX conjugate at t = 0h; 2) after IV injection and prior to photo therapy (PT) at t = 24h; 3) immediately after PT, 4) at termination, 3 days or 72 hours after PT, t = 96h. Photo therapy was administered superficially.
After interstitial TPT treatment, there was visible reduction of GFP fluorescence on the right flank tumors of both treatment groups, with less visible fluorescence intensity observed in the tumor of the 300 J/cm treatment group compared to the 100 J/cm treatment group (Fig 4). Seventy-two hours after treatment, an increase in GFP fluorescence signal was visible on the right flank tumor of both treatment groups; although this is noticeably less than the GFP fluorescence signal at baseline and before TPT.
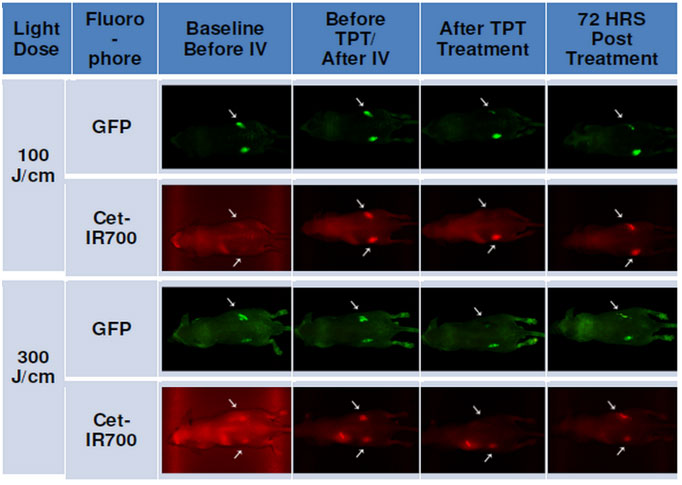
Fig 4. Whole animal imaging of GFP (green) and Cet-IR700 (red) fluorescence for mice treated with interstitial irradiation.
1) before intravenous (IV) injection of Cet-IR700 conjugate t = 0h; 2) after IV injection and prior to photo therapy (PT) t = 24h; 3) immediately after PT; 4) at termination, 3 days or 72 hours after PT, t = 96h. Photo therapy was administered interstitially.
Prior to intravenous injection (IV) of Cet-IR700DX conjugate, the red fluorescence signal of the dye was not observed (Figs 3 and 4). After IV however, both left and right flank tumors showed red fluorescence of Cet-IR700DX indicating the specific binding of the conjugate to cancer cells. Complete loss of Cet-IR700DX red fluorescence was observed immediately after TPT treatment of the right tumor compared to the left untreated tumor. As expected, some fluorescence signal of Cet-IR700DX conjugate returned 72 hours post treatment due to residual compound remaining in the mouse’s system.
Quantitative analysis of GFP fluorescence intensity in subcutaneous tumors before and after TPT
The average relative GFP fluorescence intensity measurements of left and right flank tumors of mice treated with TPT superficially at 50 J/cm2 (Fig 5A) and 250 J/cm2 (Fig 5B) fluences are presented in the following graphs. These data correspond with the observed fluorescence imaging results presented in Figure 3. Compared to the left untreated tumor (grey bars), the relative GFP fluorescence intensity decreased significantly immediately after TPT on both treatment groups (yellow bars) (50 J/cm2: t(0.0270) < 0.05 and 250 J/cm2: t(0.0420) < 0.05, post-hoc Welch t-test).
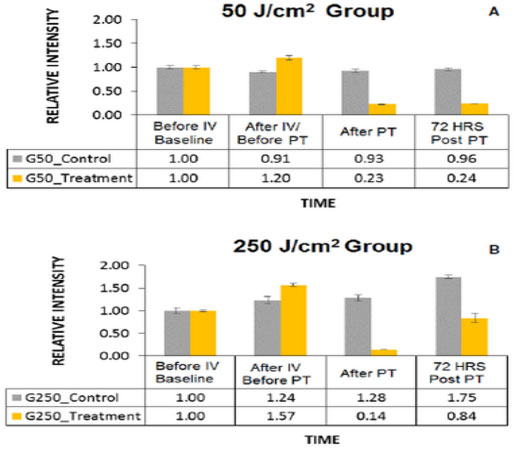
Fig 5. Mean relative fluorescence intensity measurements from mice tumors treated with superficial TPT.
Mean relative fluorescence intensity of GFP in the control (shown in gray) and treated (shown in yellow) tumors of mice in 50 J/cm2 (A) and 250 J/cm2 (B) treatment groups at four time points: 1) before intravenous (IV) injection of Cet-IR700DX conjugate t = 0h, 2) after IV injection and prior to photo therapy (PT) t = 24 hours, 3) immediately after PT, 4) at termination, 72 hours after PT, t = 96 hours.
In addition, statistical analysis via the One-Factor ANOVA with repeated measures test showed that there was a significant difference in GFP fluorescence intensity levels among the four time points in both treatment groups (50J/cm2: F(0.0001)<0.05; 250J/cm2: F(0.022)<0.05).
The GFP fluorescence intensity had significantly decreased by 81% in the 50 J/cm2 treatment group (p(0.0001)<0.05, post-hocTukey-Kramer test) and by 91%% in the 250 J/cm2 treatment group (p(0.0176)<0.05, Tukey-Kramer test) immediately after TPT, compared to the GFP fluorescence intensity levels of each group prior to TPT. While 44% of GFP fluorescence signal returned in the 250 J/cm2 treatment group (p(0.1170) > 0.05, Tukey-Kramer test), and 1% in the 50 J/cm2 treatment group (p(0.999)>0.05, Tukey-Kramer test) 72 hours post TPT compared to the GFP fluorescence signals after TPT, the increase was not significant.
The difference in cytotoxic effects between the two groups immediately after TPT was not significant (t(0.341) > 0.05, post-hoc Welch t-test) according to a Welch One Way ANOVA test. However, the difference in recovery levels 72 hours post treatment (72 HRS Post PT) between the two groups as indicated by the increase in the relative GFP fluorescence intensity level (1% for 50J/cm2 group and 44% for 250 J/cm2 group), was statistically significant (t(0.001) < 0.05, Welch t-test).
The variability in the fluorescence intensity values between baseline and before TPT time points (likely increase due to tumor growth) in both treatment groups was not significant (50J/cm2: p(0.2010) > 0.05 and 250 J/cm2: p(0.1833) > 0.05, Tukey-Kramer test).
The graphs in Fig 6 show the mean relative GFP fluorescence intensity of left and right flank tumors of mice treated with TPT interstitially at 100 J/cm (Fig 6A) and 300 J/cm (Fig 6B) light doses. These data correspond with the observed fluorescence imaging results presented in Figure 4. Statistical analysis via the One-Factor ANOVA with repeated measures test showed that there was a significant difference in GFP fluorescence intensity levels among the four time points in both treatment groups (100J/cm: F(0.0020) < 0.05; 300J/cm: F(0.0010) < 0.05). The GFP fluorescence intensity had significantly decreased by 69% in the 100 J/cm treated group (p(0.0123) < 0.05, post-hocTukey-Kramer test) and by 84% in the 300 J/cm treated group (p(0.0002) < 0.05, Tukey-Kramer test) immediately after TPT (blue bars),
compared to the GFP fluorescence intensity levels of each group prior to TPT. While 11% of GFP fluorescence signal returned at 72 hours post TPT in the 300 J/cm treatment group, this change was not significant (p(0.7532) > 0.05, Tukey-Kramer test). There was no return of GFP fluorescence signal at 72 hours post TPT in the 100 J/cm treatment group.
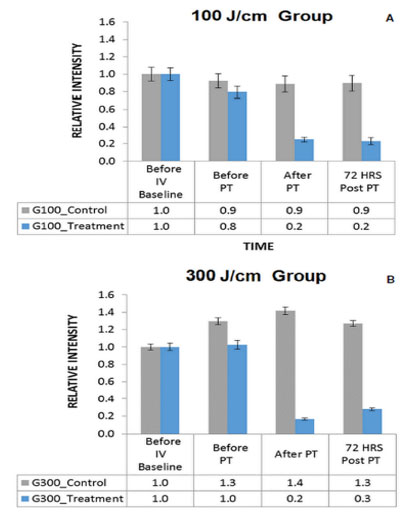
Fig 6. Mean relative fluorescence intensity measurements from mice tumors treated with interstitial TPT.
Mean relative fluorescence intensity of GFP in the control (shown in gray) and treated (shown in blue) tumors of mice in 100 J/cm (A) and 300 J/cm (B) treatment groups at four time points: 1) before intravenous (IV) injection of Cet-IR700DX conjugate t = 0h, 2) after IV injection and prior to PT t = 24 hours, 3) immediately after PT, 4) at termination, 72 hours after PT, t = 96 hours.
A Kruskal-Wallis One Way ANOVA H test followed by Mann-Whitney U test showed that there was no difference in therapeutic efficacy between the 100J/cm and 300J/cm group immediately after TPT (U=9.0, z(0.1444) > 0.05) and at 72 hours after TPT(U=6.0, z(0.5000) > 0.05).
The slight variability in the fluorescence intensity values between baseline and before TPT time points in both treatment groups was not significant (100J/cm: p(0.3530) > 0.05 and 300 J/cm: p(0.9960) > 0.05, Tukey-Kramer test).
No adverse events were observed in each experimental group during or after TPT treatment.
Immunohistological analysis of tumor tissue samples
Standard H&E staining was used to evaluate the morphology of tissue after TPT compared to control and to demonstrate necrosis resulting from treatment. Therapeutic efficacy and tumor viability were evaluated using GFP immunohistochemical staining.
All samples had tissue slides stained with H&E and with GFP immunohistochemical stains. For the purposes of this report, only representative slides were included. Moreover, only representative H&E results of the groups treated with superficial TPT were included, while representative GFP immunohisto-stain results of the groups treated with interstitial TPT were included.
Overall damage to tumor cells and the extracellular matrix were observed in this study after TPT (right tumors) compared to control (left tumors). The histological sections of treated tumors showed extracellular matrix (ECM) fragmentation and detachment, vacuolation of the ECM, loss of cytoplasmic membrane and loss of cell roundness compared to control; which are morphological characteristics of photo-damaged tissues [36-40].
There was more significant damage observed in tumors treated at the 50J/cm2 light dose (Fig 7, right) compared to those treated at the 250 J/cm2 dose (Fig 8, right). The H&E stained histological tissue sample of a treated tumor depicted in Fig 8 (right image) for the 250 J/cm2 treatment group, shows the presence of viable cells, while the tissue sample of the 50 J/cm2 treatment group (Fig 7) shows mostly damaged cells (elongated nuclei fragments and loss of cytoplasmic membrane), and detached ECM compared to control.
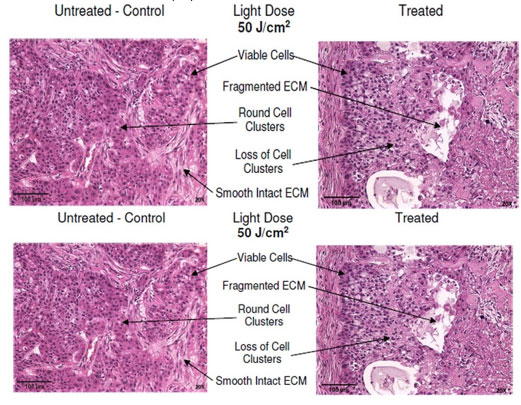 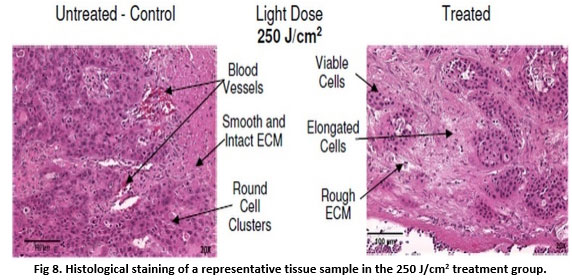
Fig 7. Histological staining of representative tissue sample in the 50 J/cm2 treatment group.
Routine hematoxylin and Eosin (H&E) histological staining was performed on tissue sections (Purple). Color code: Pink -Tissue Structures (ECM, Erythrocytes, Blood Vessels, Muscle Fibers, Skin, Fat, Collagen), Dark Blue/Purple – Nucleus.
Fig 8. Histological staining of a representative tissue sample in the 250 J/cm2 treatment group.
Routine hematoxylin and Eosin (H&E) histological staining was performed on tissue sections (Purple). Color code - Pink -Tissue Structures (ECM, Erythrocytes, Blood Vessels, Muscle Fibers, Skin, Fat, Collagen), Dark Blue/Purple – Nucleus.
In tumor samples irradiated interstitially (Figs 9 and 10), there was more significant damage observed in tumors treated at the high 300J/cm light dose (Fig 10) compared to those treated at the low 100 J/cm dose (Fig 9).
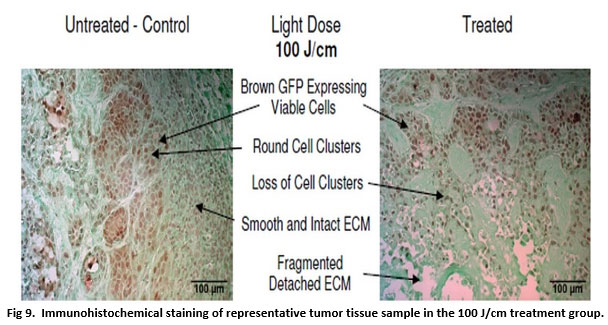
Fig 9. Immunohistochemical staining of representative tumor tissue sample in the 100 J/cm treatment group.
The GFP protein in viable BxPC-3 cells was detected with anti-GFP antibody along with horseradish peroxidase DAB brown staining; tissue was counterstained with Fast Green FCF (green), and nuclear Hematoxylin (blue).
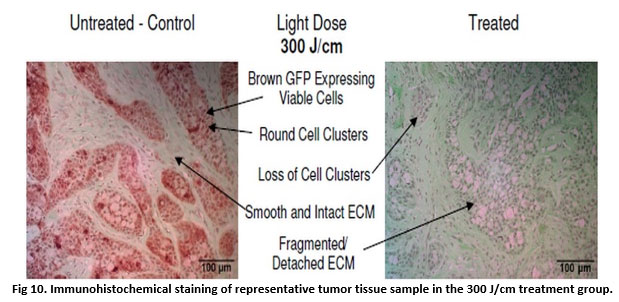
Fig 10. Immunohistochemical staining of representative tumor tissue sample in the 300 J/cm treatment group.
The GFP protein in viable BxPC-3 cells was detected with anti-GFP antibody along with horseradish peroxidase DAB brown staining; tissue was counterstained with Fast Green FCF (green), and nuclear Hematoxylin (blue).
In treated tumors of the 100 J/cm group (Fig 9), while there was some damage to the tumor tissue and some loss of GFP stain, there was retention of viable cells throughout the tumor tissue compared to control tissue samples, as evidenced by presence of round cells clusters and brown GFP stain. TPT in the right flank tumors of the 300 J/cm group (Fig 10) resulted in loss of GFP brown stain compared to control tissue samples.
Histological analysis of normal tissue after TPT
The morphology of blood vessels, muscle tissue and adipose tissue after TPT (Fig 11, treated) was comparable to the morphology of these tissue components in control samples (Fig 11, untreated). No damage to these tissue structures was observed after irradiation.
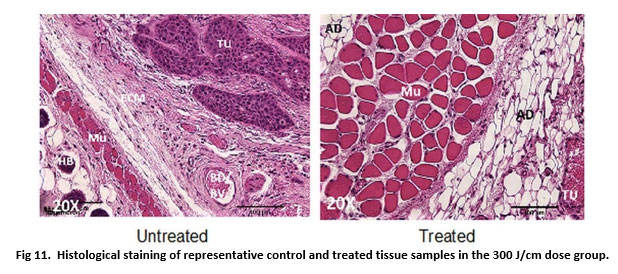
Fig 11. Histological staining of representative control and treated tissue samples in the 300 J/cm dose group.
Routine hematoxylin and Eosin (H&E) histological staining was performed on tissue sections. Legend: ECM – Extracellular Matrix; TU – tumor; Mu – Muscle; AD – Adipose Tissue; HB – Hair bulb; BD/BV – Blood/Blood vessel.
Discussion
The effectiveness of targeted photo therapy administered superficially has been demonstrated to selectively induce some cytotoxicity in different types of cancers in vitro and in vivo immediately after treatment, and more complete cytotoxicity in the long-term after repeated irradiations (11-23).
In the present study, we investigated the effectiveness of both superficial and interstitial administration of Cetuximab-IR700DX based near-infrared targeted photo therapy (NIR-TPT) in pancreatic cancer in vivo, to compare the therapeutic efficacy of TPT under different light delivery mechanisms.
GFP was used to assess treatment results of Cet-IR700DX based NIR-TPT qualitatively (Figs 3 and 4), quantitatively (Figs 5 and 6) and histochemically (Figs 9 and 10), demonstrating its multi-utility in a single study, and its effectiveness as a marker of therapeutic efficacy. As communicated earlier, the degree of cytotoxicity was determined by the decrease in GFP fluorescence intensity levels. Establishing the initial conditions as 100% intensity level to indicate complete cell viability, and 0% intensity level to indicate complete cell death in a tumor sample, the lower the GFP intensity level, the higher the degree of cytotoxicity elicited by the treatment.
Analogous to results of other TPT studies (41-43), acute cytotoxicity was achieved immediately after treatment under both light delivery strategies; GFP fluorescence intensity decreased immediately after TPT by 81% (p<0.05) and by 91% (p<0.05) in tumors treated superficially at 50 J/cm2 and 250 J/cm2 respectively compared to controls (Fig 3), and by 69% (p<0.05) and 84% (p<0.05) in tumors treated interstitially at 100 J/cm and 300 J/cm respectively compared to controls (Fig 4). Preliminarily, these data indicate that superficial TPT was more effective in eliciting acute cytotoxicity as indicated by higher signal loss percentages, compared to interstitial TPT. However, 72 hours post treatment, GFP fluorescence signal recovery was observed in both light dose of the superficial TPT treatment groups, and in the higher dose of the interstitial TPT treatment group. These results support the data of other TPT studies that demonstrated that a single TPT treatment did not inhibit cancer recurrence, and that repeated treatments were necessary to kill almost all cancer cells in the long-term (41-43).
While the higher light dose resulted in higher GFP signal loss in both light delivery strategies immediately after treatment, the interstitial TPT strategy resulted in less GFP fluorescence signal recovery 72 hours post irradiation and thus more complete cytotoxic effect (0% recovery at 100 J/cm, and 11% recovery at 300 J/cm), compared to superficial TPT (1% and 44% recovery at 50J/cm2 and 250 J/cm2 respectively). These signal recovery data were not statistically significant intra groups (p>0.05 among low and high doses), but were statistically significant inter groups (p<0.05 between interstitial and superficial treatments).
These data demonstrated that interstitial TPT was more effective in achieving long-term cytotoxicity as indicated by lower signal recovery 72 hours post treatment (less viable cells present) compared to superficial TPT. In addition, these data demonstrated that better long-term cytotoxicity was achieved at lower light doses in both light delivery strategies (0% and 1% signal recovery at 100 J/cm interstitially and 50 J/cm2 superficially, respectively).
These quantitative results were further supported by histological results, which showed significant tissue damage in treated samples compared controls (Figs 7 to 10), as indicated by fragmented ECM and loss of viable round cell clusters in treated samples compared to controls. Furthermore, in histological samples of tumors treated interstitially, reduced amount of brown GFP stain in treated samples compared to controls was indicative to loss of viable cells (Figs 9 and 10). Samples treated superficially had residual viable cells after low and high light dose treatments, whereas samples treated interstitially had some residual viable cells at 100 J/cm and no present residual viable cells at 300 J/cm. This demonstrated that interstitial illumination elicited more complete cytotoxicity compared to superficial illumination.
Damage to normal tissue components such as muscle, skin, blood vessels and adipose tissue however was not observed (Fig 11); demonstrating the selectivity of Cet-IR700DX based NIR-TPT to tumor cells only. Co-localization of the red fluorescence of the IR700DX dye and green fluorescence of the GFP protein present in BxPC-3 cells of the mice subcutaneous tumors observed in the in vivo imaging data (Figs 3 and 4) also demonstrated the selectivity of Cet-IR700DX conjugate to tumor cells.
While male mice were used in the study to reduce cost and use of animals, it could have presented bias in the results. A study including both male and female mice will be conducted in the future to account for sex as a possible source of bias. Furthermore, a study using a more physiologically relevant animal model, such as an orthotopic pancreatic cancer mouse model, will be conducted to confirm the results obtained in this study.
Conclusion
Overall, Cetuximab-IR700DX based near infra-red targeted phototherapy was effective in inducing selective killing of pancreatic cancer cells in vivo in a subcutaneous xenograft mouse model, especially at the low light dose. Cetuximab-IR700DX based TPT administered interstitially however, was more effective at inducing long-term selective necrotic cell damage, as demonstrated by the lower GFP fluorescence signal recovery at both dosimetries and more tissue damage present in histological tissue samples of treated tumors, compared to superficial TPT. Interstitial TPT thus, could be a better method to achieve more complete cytotoxicity after a single treatment, compared to achieving complete cytotoxicity after repeated treatments; which can lead to therapy induced resistance in treated tumors.
While these results are promising, further studies are needed to determine the optimal light delivery strategy, TPT conjugate, and light dose combination that will result in maximum cytotoxicity and long-term prevention of cancer recurrence and metastasis.
Acknowledgements The author acknowledges the National Cancer Institute (NIH Diversity Supplement 3R01CA142669-05S1), the University of California San Diego UCSD Cancer Center Microscopy Shared Facility program (NIH Support Grant P30 CA23100), Dr. Michael Bouvet, and Aspyrian Therapeutics, Inc., for supporting this project.
1. Dimastromatteo J, Houghton JL., Lewis JS., Kelly KA. Challenges of pancreatic cancer. Cancer Journal (Sudbury, Mass.). 2015; 21 (3): 188-93. doi:10.1097/PPO.0000000000000109. https://doi.org/10.1097/PPO.0000000000000109 PMid:26049698 PMCid:PMC4517183
2. Gianmauro N, Longo V, Courthod G, Silvestris N. Cancer survivorship: long-term side-effects of anticancer treatments of gastrointestinal cancer. Current Opinion in Oncology 27. 2015; 4: 351-57. doi:10.1097/CCO.0000000000000203. https://doi.org/10.1097/CCO.0000000000000203 PMid:26049277
3. Vanja V, Sperduti I, Vari S, Bria E, Melisi D, Garufi C, et. al. Metastatic pancreatic cancer: is there a light at the end of the tunnel? World Journal of Gastroenterology: WJG. 2015; 21(16): 4788-4801. doi:10.3748/wjg.v21.i16.4788. https://doi.org/10.3748/wjg.v21.i16.4788 PMid:25944992 PMCid:PMC440845
4. American Cancer Society. Cancer facts & figures. 2014.
5. Vivek M, Moser JA. Current management of locally advanced pancreatic cancer. Nature Clinical Practice. Gastroenterology & Hepatology. 2005; 2(8): 356-64. doi: 10.1038/ncpgasthep0240. https://doi.org/10.1038/ncpgasthep0240
6. McGrath, PC, Sloan DA, Kenady DE. Surgical management of pancreatic carcinoma. Seminars in Oncology. 1996; 23(2): 200-212.
7. Nakao, A. Oncological problems in pancreatic cancer surgery. Nagoya Journal of Medical Science. 2000; 63(1-2): 1-7.
8. Rosenberg, L. Pancreatic cancer: a review of emerging therapies. Drugs.2000; 59(5): 1071-89. https://doi.org/10.2165/00003495-200059050-00004 PMid:10852640
9. Schnall, SF, Macdonald JS. Chemotherapy of adenocarcinoma of the pancreas. Seminars in Oncology.1996; 23(2): 220-28
10. Thomas, PR. Radiotherapy for carcinoma of the pancreas. Seminars in Oncology. 1996; 23(2): 213-19.
11. Mew, D, Wat CK, Towers GH, Levy J. G. Photoimmunotherapy: treatment of animal tumors with tumor-specific monoclonal antibody-hematoporphyrin conjugates. Journal of Immunolog. 1983; 130(3): 1473-77
12. Wat, CK, Mew D, Levy JG, and Towers GH. Photosensitizer-protein conjugates: potential use as photoimmunotherapeutic agents. Progress in Clinical and Biological Research.1984; 170: 351-59
13. Goff, BA., Bamberg M, Hasan T. Photoimmunotherapy of human ovarian carcinoma cells ex vivo. Cancer Research. 1991; 51(18): 4762-67
14. Pogrebniak HW, Matthews W, Black C, Russo A, Mitchell JB, Smith P, et al. Targeted phototherapy with sensitizer-monoclonal antibody conjugate and light. Surgical Oncology.1993; 2(1): 31-42. https://doi.org/10.1016/0960-7404(93)90042-W
15. Mitsunaga M, Ogawa M, Kosaka N, Rosenblum LT, Choyke PL, Kobayashi H. Cancer cell-selective in vivo near infrared photoimmunotherapy targeting specific membrane molecules. Nat Med. 2011; 17(12):1685-91. doi: 10.1038/nm.2554. https://doi.org/10.1038/nm.2554 PMid:22057348 PMCid:PMC3233641
16. Mitsunaga M, Nakajima T, Sano K, Kramer-Marek G, Choyke PL, Kobayashi H. Immediate in vivo target-specific cancer cell death after near infrared photoimmunotherapy. BMC Cancer.2012; 12:345. doi: 10.1186/1471-2407-12-345. https://doi.org/10.1186/1471-2407-12-345 PMid:22873679 PMCid:PMC3502522
17. Sato K, Choyke PL, Kobayashi H. Photoimmunotherapy of gastric cancer peritoneal carcinomatosis in a mouse model. 2014; PLoS One. 9(11): e113276. doi: 10.1371/journal.pone.0113276. https://doi.org/10.1371/journal.pone.0113276 PMid:25401794 PMCid:PMC4234664
18. Yukihiko H, Maawy A, Zhang Y, Garcia-Guzman M, Heim R, Makings L, et al. Photoimmunotherapy inhibits tumor recurrence after surgical resection on a pancreatic cancer patient-derived orthotopic xenograft (pdox) nude mouse model. Annals of Surgical Oncology. 2015; 22(3): 1469-1474. doi:10.1245/s10434-015-4553-9. https://doi.org/10.1245/s10434-015-4553-9 PMid:25893411 PMCid:PMC7711336
19. Maawy A., Yukihiko H, Zhang Y, Heim R, Makings L, Garcia-Guzman M, et al. Near infra-red photoimmunotherapy with anti-cea-ir700 results in extensive tumor lysis and a significant decrease in tumor burden in orthotopic mouse models of pancreatic cancer. PloS One. 2015; 10(3): e0121989. doi:10.1371/journal.pone.0121989. https://doi.org/10.1371/journal.pone.0121989 PMid:25799218 PMCid:PMC4370703
20. Sato K, Hanaoka H, Watanabe R, Nakajima T, Choyke PL, Kobayashi H. Near infrared photoimmunotherapy in the treatment of disseminated peritoneal ovarian cancer. Molecular Cancer Therapeutics. 2015: 14(1): 141-50. doi:10.1158/1535-7163.MCT-14-0658. https://doi.org/10.1158/1535-7163.MCT-14-0658 PMid:25416790 PMCid:PMC4297245
21. Sato K, Nagaya T, Nakamura Y, Harada T, Choyke PL, Kobayashi H. Near infrared photoimmunotherapy prevents lung cancer metastases in a murine model. Oncotarget. 2015; 6:19747-19758. doi: 10.18632/oncotarget.3850. https://doi.org/10.18632/oncotarget.3850 PMid:25992770 PMCid:PMC4637318
22. Shimoyama K, Kagawa S, Ishida M, Watanabe S, Noma K, Takehara K, et al. Viral transduction of the her2-extracellular domain expands trastuzumab-based photoimmunotherapy for her2-negative breast cancer cells. Breast Cancer Research and Treatment. 2015;149 (3): 597-605. doi:10.1007/s10549-015-3265-y. https://doi.org/10.1007/s10549-015-3265-y PMid:25616354
23. Watanabe R, Hanaoka H, Sato K, Nagaya T, Harada T, Mitsunaga M, et al. Photoimmunotherapy targeting prostate-specific membrane antigen: are antibody fragments as effective as antibodies? Journal of Nuclear Medicine: Official Publication, Society of Nuclear Medicine. 2015; 56(1): 140-44. doi:10.2967/jnumed.114.149526. https://doi.org/10.2967/jnumed.114.149526 PMid:25500827 PMCid:PMC6484861
24. Tsien RY. The green fluorescent protein. Annual Review of Biochemistry. 1998; 67: 509-44. doi:10.1146/annurev.biochem.67.1.509.
https://doi.org/10.1146/annurev.biochem.67.1.509 PMid:9759496
25. Chudakov DM., Lukyanov S, Lukyanov KA. Fluorescent proteins as a toolkit for in vivo imaging. Trends in Biotechnology. 2005; 23(12): 605-13. doi:10.1016/j.tibtech.2005.10.005. https://doi.org/10.1016/j.tibtech.2005.10.005 PMid:16269193
26. Enterina JR, Wu L, Campbell RE. Emerging fluorescent protein technologies. Current Opinion in Chemical Biology .2015; 27: 10-17. doi:10.1016/j.cbpa.2015.05.001. https://doi.org/10.1016/j.cbpa.2015.05.001 PMid:26043278
27. Gerdes HH, Kaether C. Green fluorescent protein: applications in cell biology. FEBS Letters. 1996; 389(1): 44-47.
https://doi.org/10.1016/0014-5793(96)00586-8
28. Johnson, W L, Straight AF. Fluorescent protein applications in microscopy. Methods in Cell Biology. 2013; 114: 99-123. doi:10.1016/B978-0-12-407761-4.00005-1. https://doi.org/10.1016/B978-0-12-407761-4.00005-1 PMid:23931504
29. Kain N. Green fluorescent protein (gfp): applications in cell-based assays for drug discovery. Drug Discovery Today .1999; 4(7): 304-12. https://doi.org/10.1016/S1359-6446(99)01330-6
30. March JC, Rao G, Bentley WE. Biotechnological applications of green fluorescent protein. Applied Microbiology and Biotechnology. 2003; 62 (4): 303-15. doi:10.1007/s00253-003-1339-y. https://doi.org/10.1007/s00253-003-1339-y PMid:12768245
31. Hoffman RM. Green fluorescent protein to visualize cancer progression and metastasis. Methods in Enzymology, Academic Press. 1999; 302: 20-31. ISBN 9780121822033. https://doi.org/10.1016/S0076-6879(99)02005-4
32. Hoffman RM. Orthotopic transplant mouse models with green fluorescent protein-expressing cancer cells to visualize metastasis and angiogenesis. Cancer and Metastasis Reviews. 1999; 17:271-277. https://doi.org/10.1023/A:1006188412324 PMid:10352880
33. Miller B. OpenStat statistical software (http://statpages.info/miller)
34. Festing MFW, Altman DG. Guidelines for the design and statistical analysis of experiments using laboratory animals. ILAR Journal. 2002; 43(4): 244-58, doi:10.1093/ilar.43.4.244. https://doi.org/10.1093/ilar.43.4.244 PMid:12391400
35. Nayak BK, Hazra A. How to choose the right statistical test? Indian Journal of Ophthalmology. 2011; 59 (2): 85-86, doi:10.4103/0301-4738.77005. https://doi.org/10.4103/0301-4738.77005 PMid:21350275 PMCid:PMC3116565
36. Peng CL.; Shih YH, Lee PC, Hsieh MH, Luo TY, Shieh MJ. Multimodal image-guided photothermal therapy mediated by 188 re-labeled micelles containing a cyanine-type photosensitizer. ACS Nano. 2011; 5 (7): 5594-5607. https://doi.org/10.1021/nn201100m PMid:21671580
37. De Magalhães N, Liaw LH, Berns MW, Cristini V., Chen Z., Stupack D., et al. Applications of a new in vivo tumor spheroid based shell-Less chorioallantoic membrane 3-D model in bioengineering research. J Biomed Sci Engineering. 2010; 3 (1):20-26. doi:10.4236/jbise.2010.31003. https://doi.org/10.4236/jbise.2010.31003 PMid:21243108 PMCid:PMC3019609
38. Alvarez, A. Cell death. A comprehensive approximation. Necrosis. Microscopy: Science, Technology, Application, and Education. 2010; 3: 1017-1024
39. Van Cruchten S, Van den Broeck W. Morphological and biochemical aspects of apoptosis, oncosis and necrosis. Anatomia, Histologia, Embryologia. 2002; 31: 214-223. doi: 10.1046/j.1439-0264.2002.00398.x https://doi.org/10.1046/j.1439-0264.2002.00398.x PMid:12196263
41. Mitsunaga M, Nakajima T, Sano K, Choyke PL, Kobayashi H. Near-infrared theranostic photoimmunotherapy (PIT): repeated exposure of light enhances the effect of immunoconjugate. Bioconjug Chem. 2012; 23(3):604-9. doi: 10.1021/bc200648m. https://doi.org/10.1021/bc200648m PMid:22369484 PMCid:PMC3401044<
42. Takahito N, Sano K, Choyke PL, Kobayashi H. Improving the efficacy of photoimmunotherapy (PIT) using a cocktail of antibody conjugates in a multiple antigen tumor model. Theranostics. 2013; 3(6): 357-65. doi:10.7150/thno.5908. https://doi.org/10.7150/thno.5908 PMid:23781283 PMCid:PMC3677407
43. Sato K, Watanabe R, Hanaoka H, Harada T, Nakajima T, Kim I, et al. Photoimmunotherapy: comparative effectiveness of two monoclonal antibodies targeting the epidermal growth factor receptor. Mol Oncol. 2014; 8(3):620-32. doi: 10.1016/j.molonc.2014.01.006. https://doi.org/10.1016/j.molonc.2014.01.006 PMid:24508062 PMCid:PMC4004687
44. Van Cutsem E, Köhne C-H, Hitre E, Zaluski J, Chien C-R, Makhson A, et al. Cetuximab and chemotherapy as initial treatment for metastatic colorectal cancer. N. Engl. J. Med. 2009; 360 (14): 1408–17. doi:10.1056/NEJMoa0805019. https://doi.org/10.1056/nejmoa0805019 PMID: 19339720
45. Mitsunaga M, Ogawa M, Kosaka N, Rosenblum LT, Choyke PL, Kobayashi H. Cancer cell-selective in vivo near infrared photoimmunotherapy targeting specific membrane molecules. Nat Med. 2011; 17(12):1685-91. doi: 10.1038/nm.2554. https://doi.org/10.1038/nm.2554 PMID: 22057348; PMCID: PMC3233641
>46. S. Miwa, N. De Magalhães, M. Toneri, Y. Zhang, N. Yamamoto, M. Bouvet, H. Tsuchiya, RM. Hoffman. Fluorescence-guided surgery of human prostate cancer experimental bone metastasis in nude mice using anti-CEA DyLight 650 for tumor illumination. Journal of Orthopaedic Research. 2015; 34(3): 559-565.doi:10.1002/jor.22973. https://doi.org/10.1002/jor.22973
|